Bitcoin ETFs Draw $526.6 Million on October 19, Cutting the Month’s Outflow Deficit to $90.57 Million

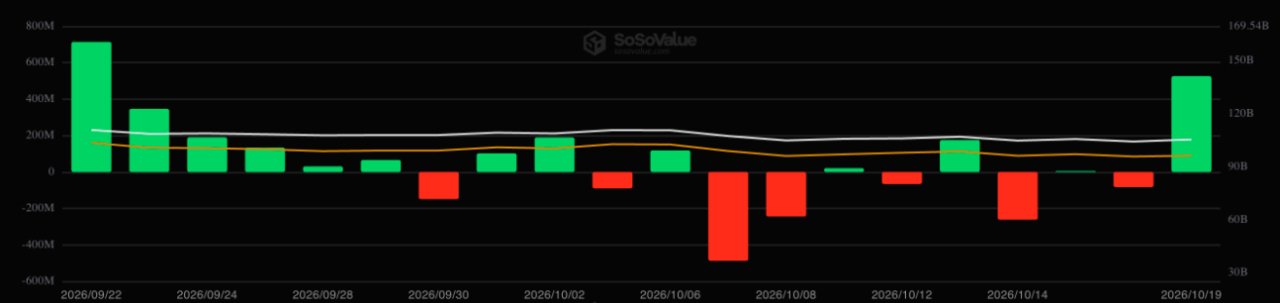
US spot Bitcoin ETFs recorded $526.6 million in net inflows on Monday, October 19 — their largest single-day total since September 22. The session was driven entirely by BlackRock’s IBIT; none of the other 11 Bitcoin funds posted net inflows. Ethereum ETFs shed $103.28 million the same day, extending a run of outflows on 14 of the last 15 trading sessions totalling $1.12 billion.
Key Takeaways
US spot Bitcoin ETFs drew $526.6 million in net inflows on October 19, the largest single day since September 22 ($714.75 million).
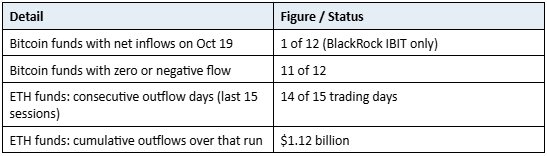
The inflow was concentrated entirely in BlackRock’s IBIT; 11 of 12 Bitcoin ETFs recorded zero or negative net flows on the day.
Before Monday, Bitcoin ETFs had lost a net $617.17 million in October. After Monday’s session the month-to-date net stood at −$90.57 million.
Ethereum ETFs shed $103.28 million and Solana products lost $6.72 million on the same day, moving in the opposite direction to Bitcoin.
ETH ETFs have posted net outflows on 14 of the last 15 trading days, totalling $1.12 billion.
Bitcoin closed the prior week down about 2% and held $80,000 support, while the Nasdaq fell 5% and the semiconductor index dropped more than 11%.
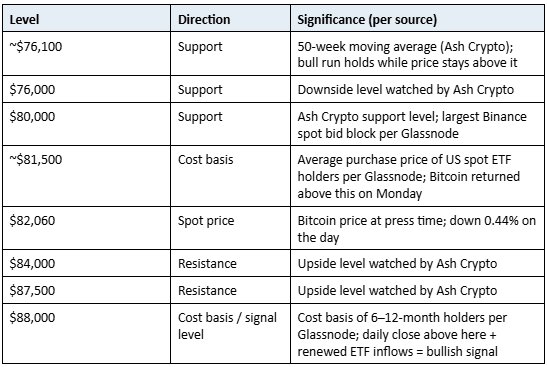
Bitcoin returned above the ETF cost basis of ~$81,500 (per Glassnode) after slipping below it the prior week; the next key signal level is a daily close above $88,000 alongside renewed ETF inflows.
The Flow Reversal in Context: What $526.6 Million Actually Changed
Monday’s inflow did not flip October into positive territory — but it came close. Between October 1 and 18, US spot Bitcoin ETFs had recorded net outflows of $617.17 million. A single session erased most of that, leaving the month-to-date figure at a net negative of $90.57 million heading into Tuesday.
It also reversed the direction set by the prior trading week. In the four sessions from October 13 to 16, Bitcoin ETFs posted a net outflow of $163.18 million. Monday’s $526.6 million erased that and then some — a reversal of more than 3x the weekly outflow in a single session.
How Monday Compares to the Broader October Picture
The September 22 session that Monday displaced as the month’s prior benchmark recorded $714.75 million in inflows. Monday’s $526.6 million is about 73.5% of that figure. Both sessions stand out against the general October trend: most of the month’s other sessions produced either small inflows, flat readings, or outflows. One large inflow day does not establish a trend, but the scale of Monday’s reversal makes it a meaningful data point in any reading of October’s ETF flow narrative.
IBIT Alone: What It Means When One Fund Drives Everything
SoSoValue data confirmed that BlackRock’s iShares Bitcoin Trust was the only one of 12 US spot Bitcoin ETFs to record a net inflow on October 19. The other 11 funds collectively posted zero or negative flows.
Source: https://sosovalue.com/assets/etf/us-btc-spot
Concentration Risk in a Single Inflow Session
When a single fund accounts for an entire day’s net inflow across a 12-product category, the flow reading reflects that fund’s institutional client base more than it reflects broad market demand. IBIT has consistently been the dominant Bitcoin ETF by assets under management since the products launched, and large daily flows in and out of IBIT tend to be driven by the decisions of a relatively small number of large institutional allocators.
This is the same dynamic observed in the Ethereum ETF outflow data from early October, where BlackRock’s ETHA accounted for $477 million of a $542 million weekly outflow. Flows in US spot crypto ETFs are concentrated, and single-session readings should be interpreted with that concentration in mind rather than as a signal of broad retail or institutional conviction.
Ethereum and Solana ETFs: Moving the Other Way
While Bitcoin ETFs recorded their best day in weeks, Ethereum and Solana products moved in the opposite direction. ETH ETFs shed $103.28 million on Monday, and Solana ETF products lost $6.72 million.
The 14-of-15 Pattern in ETH ETFs
The Monday Ethereum outflow was not an isolated event. US spot Ethereum ETFs have now posted net outflows on 14 of the last 15 trading days, with cumulative outflows across that run reaching $1.12 billion. That pace represents a sustained withdrawal of institutional capital from Ethereum products, at a time when Bitcoin products were receiving their largest single-session inflow in nearly a month.
The divergence between Bitcoin and Ethereum ETF flows on October 19 — one posting its best day since late September, the other continuing a near-unbroken streak of outflows — reflects a rotation dynamic that has been visible for several weeks. Capital that entered Ethereum ETFs during Q3’s strong inflow period appears to be unwinding, while Bitcoin ETFs are beginning to attract renewed interest from institutional buyers.
Bitcoin vs Tech Stocks: A Week of Divergence
The ETF inflow day followed a week in which Bitcoin demonstrated relative strength against US equities. Bitcoin closed the week ended October 17 down approximately 2% and held the $80,000 price level, while the Nasdaq Composite fell 5% and the Philadelphia Semiconductor Index dropped more than 11%.
Why the Relative Performance Matters
Bitcoin’s resistance to the equity selloff reinforced a narrative that has appeared in several analyst notes in recent months: that Bitcoin may be decoupling from the high-beta technology equity basket with which it was closely correlated during 2023 and 2024. When semiconductor stocks — the most AI-sensitive segment of the Nasdaq — dropped more than 11% in a week and Bitcoin lost only 2%, institutional investors with cross-asset mandates took notice.
Analyst Ash Crypto specifically highlighted Bitcoin’s ability to hold $80,000 during the tech selloff as a positive signal. The $80,000 level is notable not only as a round-number psychological support but because Glassnode data placed the largest Binance spot bid block at exactly that level. A price level with both psychological and order-book significance is harder to break than one supported by only one of those factors.
Key Price Levels: Where Bitcoin Stands and What to Watch
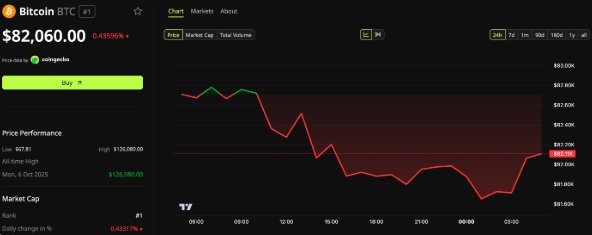
At press time, Bitcoin traded at $82,060, down 0.44% over the prior 24 hours according to BeInCrypto Markets data. That puts it back above the ETF cost basis of approximately $81,500, a level Bitcoin had slipped below the prior week.
The 50-Week Moving Average and What It Signals
Ash Crypto noted that Bitcoin has closed above its 50-week moving average for five consecutive weeks. That moving average sits near $76,100. In the analyst’s framing, the bull run holds as long as price remains above that level. Five weekly closes above it provide more confirmation than a single week would, but the test only becomes meaningful if Bitcoin approaches that level under selling pressure.
The $88,000 Signal and the Second Condition
Glassnode identifies $88,000 as the cost basis of six-to-12-month holders — investors who bought Bitcoin between roughly October 2025 and April 2026. When price approaches this cohort’s average purchase price, they become potential sellers: those who are breakeven or slightly in profit may choose to exit, creating supply overhang.
A daily close above $88,000 would mean Bitcoin has moved through that supply zone rather than being turned back by it. The source identifies this close, combined with renewed ETF inflows, as the signal that buyers are absorbing the supply from that cohort. Monday’s IBIT-driven session satisfies part of the second condition — renewed ETF inflows — but the price condition has not yet been met, and a single inflow session does not constitute “renewed” inflows in any sustained sense.
Bitcoin’s October Performance in Broader Perspective
Over the full month of October, Bitcoin is down 1.75% from its October 1 open. That modest decline follows a 42.71% gain in Q3 2026. The pattern is consistent with a consolidation phase after a strong quarterly move: price gives back a small percentage in the weeks following a large gain before either resuming the trend or continuing to correct.
Source: https://beincrypto.com/price/bitcoin/
The ETF cost basis level of ~$81,500 is particularly relevant in this context. When Bitcoin slipped below it last week, ETF holders as a group were briefly sitting on unrealised losses. Monday’s recovery above that level restores those holders to a breakeven or positive position on average, which tends to reduce the urgency of forced or panic selling from ETF-derived supply.
Frequently Asked Questions
How much did Bitcoin ETFs take in on October 19?
US spot Bitcoin ETFs recorded $526.6 million in net inflows on October 19, 2026 — their largest single-day total since September 22, when the funds drew $714.75 million.
Which Bitcoin ETF drove the October 19 inflow?
BlackRock’s iShares Bitcoin Trust (IBIT) was the only one of 12 US spot Bitcoin ETFs to record a net inflow on October 19, according to SoSoValue data. The other 11 funds posted zero or negative net flows.
What happened to Ethereum ETFs on October 19?
US spot Ethereum ETFs shed $103.28 million on October 19. That extended a streak of outflows on 14 of the last 15 trading days, with cumulative outflows across that run reaching $1.12 billion.
What is the ETF cost basis for Bitcoin and why does it matter?
Glassnode estimates the average price US spot Bitcoin ETFs paid for their holdings at approximately $81,500. When Bitcoin trades below that level, ETF holders are on average sitting on unrealised losses, which increases selling pressure. Bitcoin returned above that level on October 19.
What price levels is the market watching for Bitcoin?
Key support levels are $80,000 (psychological support and largest Binance bid block per Glassnode) and $76,000–76,100 (Ash Crypto support and the 50-week moving average). Key resistance is at $84,000, $87,500 and $88,000, with a daily close above $88,000 alongside renewed ETF inflows identified as the signal that buyers are absorbing supply from the 6–12-month holder cohort.
Want to join the discussion? Login and create a profile to comment.