BNB Price Analysis: Uptrend Intact at $760, But Overbought Intraday Momentum Tests the Extension Limit

BNB traded at $759.60 on its live daily candle on October 28, 2026, sitting above the daily upper Bollinger Band and all three daily exponential moving averages — a configuration that reflects genuine trend strength. The analytical tension in the current setup is not between bullish and bearish trend direction; the daily structure is clearly bullish. The tension is between the trend's direction and the condition of the short-term momentum indicators that govern whether the current extension can sustain itself without a pullback to reset. Hourly RSI at 75.8 and 15-minute RSI at 80.8 are both overbought while daily RSI remains a non-stretched 51.2 — a three-timeframe contrast that makes execution timing the critical variable.
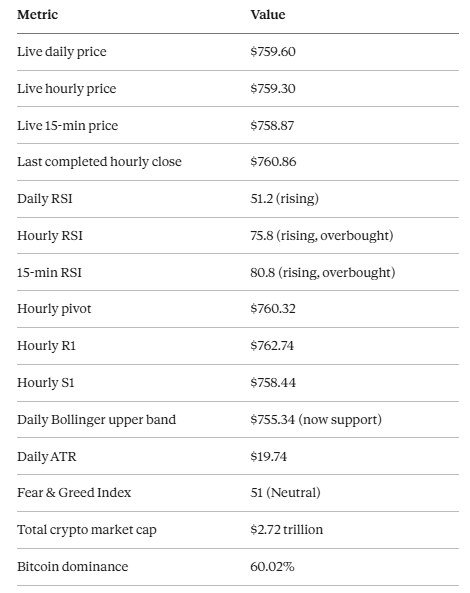
Quick Reference: Key Levels and Readings
An Important Caveat on Live vs. Completed Prices
Before examining the technical structure, a methodological point that is essential for interpreting this analysis correctly: the live prices for the daily, hourly, and 15-minute candles ($759.60, $759.30, and $758.87 respectively) belong to candles that are still open at the time of observation. The technical indicators — RSI, MACD, Bollinger Bands — are calculated on completed, closed candles, not on the live in-progress candle.
This means that an intrabar move — price touching a level while the candle is still open — should not be treated as a confirmed closing signal. When the analysis notes that the live hourly price is $759.30, below the last completed hourly close of $760.86, this describes the current live condition but does not constitute a confirmed breakdown below that close. The candle must complete and close below a level for the move to be confirmed as a technical event.
This distinction matters most when price is hovering near pivot levels, Bollinger Band boundaries, or indicator thresholds — precisely the conditions that exist for BNB at the time of this analysis.
Daily Chart: Bullish Structure Without Daily Overbought Condition
The daily chart provides the foundational bullish case, and on this timeframe the technical picture is constructive without the immediate exhaustion signals visible intraday.
Moving Average Alignment
BNB is trading above all three key daily exponential moving averages, and crucially they are bullishly stacked — meaning shorter-period averages are above longer-period ones:
Daily EMA20: $741.79 — the near-term trend average, representing approximately one month of price data
Daily EMA50: $734.78 — the medium-term trend average, approximately two months of price action
Daily EMA200: $691.81 — the long-term trend average, approximately ten months of price data
The $67.79 gap between current price and the EMA200 is worth noting: it means BNB has advanced significantly above its long-run average. For the bullish case, this signals genuine trend strength. As a risk factor, it means any significant reversal would have substantial room to fall before reaching the long-term mean. The bullish alignment also means that a modest pullback — even toward the daily EMA20 at $741.79 — would not structurally damage the trend. A retreat of 2.4% from $759.60 would reach the EMA20 without any bearish EMA crossover occurring.
Bollinger Bands: Price Above the Envelope
The daily Bollinger Bands provide a volatility context that is simultaneously a strength signal and a mean-reversion warning:
Daily upper band: $755.34 — price is currently above this level, meaning BNB has broken out of the standard 2-standard-deviation volatility envelope on the upside
Daily midpoint: $736.91 — the 20-period SMA, below which would suggest trend softening
Daily lower band: $718.47 — a level that would require a significant reversal to reach
Price above the daily upper Bollinger Band demonstrates conviction: it takes sustained buying pressure to push price beyond what statistics predict as the high-probability trading range. The daily upper band at $755.34 transitions from a resistance reference to a support reference now that price is above it — a level that acted as a ceiling becomes a floor on any near-term retest.
However, this same configuration leaves room for mean reversion. The daily midpoint at $736.91 is approximately 3% below current prices — a move back toward the midpoint would be statistically normal and would not require any change in the underlying daily trend direction. "Trading outside the upper envelope demonstrates strength, but also leaves room for mean reversion without requiring a wholesale trend reversal" is the appropriate framing.
Daily RSI at 51.2 and MACD Position
Daily RSI at 51.2 and rising is an underappreciated element of this setup. The daily trend has reclaimed the midline (50) and is building momentum from a non-overbought position. This is more supportive than a high-RSI reading that has reached 70+ — the daily recovery has momentum room to continue building without the exhaustion risk that attaches to RSI in the 70s and 80s.
The daily MACD provides a qualified positive reading: its histogram is positive and widening, indicating that the gap between the MACD line and its signal line is increasing — momentum in the bullish direction is building on the daily chart. However, the MACD line itself remains below zero. This means the shorter-term EMA (12-period) has not yet crossed above the longer-term EMA (26-period) in absolute terms. Improving momentum and a positive histogram are bullish signals, but this is not yet an unambiguously strong momentum regime — the zero-line cross has not occurred.
Daily ATR in Context
The daily Average True Range of $19.74 is the volatility context against which all pivot tests should be evaluated. A $19.74 daily range means that price swings of that magnitude are within ordinary daily activity — a move from $755.34 (daily Bollinger upper band) to $759.60 (current price) is a $4.26 move, well within a single day's expected volatility. This prevents over-reading brief pivot penetrations as definitive trend signals.
Intraday Charts: Bullish Direction, Overbought Momentum
Both the hourly and 15-minute charts confirm the bullish direction set by the daily structure, but introduce an important caveat: the momentum indicators are stretched in ways that the daily chart is not.
Hourly Chart
BNB on the hourly chart sits above all three EMAs, which are themselves bullishly stacked:
Hourly EMA20: $749.05 — $10.55 below current price
Hourly EMA50: $745.43 — $14.17 below
Hourly EMA200: $739.51 — $20.09 below
This hourly EMA alignment confirms that the directional bias is bullish at the intraday level, not just the daily level. The alignment across all three timeframes — daily, hourly, and (as we will see) 15-minute — provides internal consistency to the bullish technical picture.
The hourly Bollinger upper band at $758.07 places BNB above the hourly envelope as well — extending the price-above-upper-band configuration that exists on the daily chart into shorter timeframes.
The hourly RSI at 75.8, however, introduces execution caution. RSI above 70 is the conventional overbought threshold, and 75.8 is meaningfully above that line. Overbought RSI does not predict an immediate top — price can remain overbought for extended periods during strong trending moves — but it does indicate that the short-term move has outrun the pace that is statistically typical for this RSI calculation period. Short-term pullbacks or consolidation are more likely when RSI is at these levels than when it is in neutral territory.
The hourly MACD reinforces the directional picture: its histogram is positive and widening, confirming that hourly momentum is building on the bullish side.
Pivot levels on the hourly chart:
Hourly pivot: $760.32 — the last completed hourly candle closed above this level, technically claiming it; the live price at $759.30 has pulled back slightly below it, putting the durability of that claim under scrutiny
Hourly R1: $762.74 — the next upside reference; an hourly close above this level would confirm extension beyond listed hourly resistance
Hourly S1: $758.44 — the key near-term support; an hourly close below this would activate the pullback case
Hourly Bollinger upper band: $758.07 — sits just below hourly S1, forming a cluster of support in the $758-$758.44 zone
15-Minute Chart
The 15-minute chart provides the most granular intraday picture, and it is here that the most notable short-term caution signal appears.
EMAs again confirm bullish alignment:
15-min EMA20: $754.35
15-min EMA50: $750.29
15-min EMA200: $745.02
The 15-minute upper Bollinger Band at $763.62 is above current price — unlike the daily and hourly bands, price has not yet penetrated the 15-minute envelope's upper boundary.
The 15-minute RSI at 80.8 is the most stretched reading in this analysis. Combined with a 15-minute MACD histogram that is positive but narrowing — a divergence from the rising RSI — there is a short-term momentum signal worth watching. When RSI continues rising but the MACD histogram is narrowing, it can indicate that while momentum is still positive, its rate of change is decelerating. This RSI-MACD divergence on the 15-minute chart is the weakest element in the current BNB technical picture. It does not establish a bearish trend, but it does weaken the case for immediate acceleration at this specific timeframe.
The Two Scenarios: Breakout Confirmation vs. Controlled Pullback
The technical structure defines two clean scenarios with specific confirmation and invalidation levels:
Bullish Continuation
Trigger: An hourly close above R1 at $762.74
This would confirm that BNB has extended beyond the nearest listed hourly resistance level with a completed close — not merely an intrabar touch. Given the current overbought hourly RSI, a close above R1 would signal that buying pressure is sufficient to absorb the exhaustion risk and press higher.
Invalidation: An hourly close below S1 at $758.44 would invalidate this continuation setup.
Primary risk: The "false bullish signal" scenario — a brief intrabar push above resistance that fails to hold into the hourly close. With hourly RSI at 75.8 and 15-minute RSI at 80.8, this is the most likely type of failed upside attempt. A spike to $762+ that pulls back before the hourly candle closes would create the appearance of a breakout on a live price basis without generating the confirmed close that constitutes a technical breakout.
Pullback / Consolidation
Trigger: An hourly close below S1 at $758.44
This would activate the pullback case, exposing the hourly Bollinger upper band at $758.07 as the next support, followed by the daily Bollinger upper band at $755.34 and daily R1 at $754.79 forming a combined support area in the $754-$755 zone.
Invalidation: An hourly close back above the hourly pivot at $760.32 would invalidate the breakdown setup.
Primary risk: The "false bearish signal" scenario — a temporary dip below support while the daily EMA structure remains bullish. The daily EMAs at $741.79 (EMA20), $734.78 (EMA50), and $691.81 (EMA200) provide a deep support structure that a short-term pullback to $755 would not disturb. A trader reading a brief hourly close below $758.44 as the beginning of a sustained reversal would be acting on a signal that the daily context does not support.
BSC DEX Volume: Mixed, Not Confirmatory
Chain-wide 24-hour DEX trading volume across BNB Smart Chain stands at $925,206,012.09 — approximately $925 million in total decentralised exchange activity across the BSC ecosystem.
Two important clarifications from the article that matter for interpreting this figure:
This is chain-wide volume, not BNB-specific revenue. The $925 million measures the total value of tokens traded on decentralised exchanges deployed on BNB Chain — it includes every token pair traded on PancakeSwap, Uniswap's BNB Chain deployment, and all other DEXes. It does not directly measure demand for BNB as an asset, nor does it represent BNB's transaction fee revenue or any measure specific to BNB's own price dynamics.
The venue picture is mixed. Volume declined on two of the four venues tracked:
PancakeSwap AMM V3: −4.82%
PancakeSwap Infinity: −15.61%
Uniswap V4: +73.90%
PancakeSwap AMM: +20.83%
The Uniswap V4 increase of 73.90% is significant in absolute percentage terms but would need to be weighed against its starting base relative to PancakeSwap's much larger absolute volume. The mixed directional signals across venues — with the two PancakeSwap-branded products declining — do not support a blanket claim that DEX activity is accelerating across BSC. The volume data neither confirms the bullish technical case nor contradicts it; it simply provides no additional evidence for broad-based on-chain activity acceleration behind BNB's price move.
The ecosystem context — BNB Chain's Q3 smart-contract deployment growth and CZ's public commentary about the chain's AI capabilities — provides relevant fundamental background for why the technical structure has a coherent basis. These are legitimate data points about ecosystem health. However, as the article notes, "the supplied information does not establish either as the cause of the current price move." Correlation between ecosystem metrics and price is not the same as causation, and a disciplined technical analysis attributes price moves to what can be observed in the price structure itself rather than external narratives.
Market Context: Neutral Sentiment, High Bitcoin Dominance
Two macro data points frame the BNB analysis in the context of the broader cryptocurrency market:
Fear & Greed Index at 51 (Neutral): Alternative.me's composite crypto sentiment indicator sits precisely at the boundary between "Neutral" and "Greed" territory. A reading of 51 offers no strong directional endorsement. It means the broader market is neither in the fearful, capitulation-oriented state that typically accompanies major market bottoms and creates undervalued conditions, nor in the euphoric, overextended state that accompanies market tops and creates overvalued conditions. For BNB's technical picture, the neutral sentiment reading means the coin must rely on its own technical structure rather than a rising market tide to drive extension.
Bitcoin dominance at 60.02%, total market cap at $2.72 trillion: The 60% Bitcoin dominance figure — consistent with data discussed in other articles this week — describes an environment in which capital remains concentrated in Bitcoin rather than rotating broadly into altcoins. High Bitcoin dominance typically correlates with periods when altcoin performance lags Bitcoin, as capital flows toward the perceived safety of the market's leading asset rather than taking risk on smaller-cap alternatives. BNB is among the largest-cap altcoins and typically shows relative resilience when Bitcoin dominance is high, but the backdrop is not one in which altcoins are receiving a general tailwind from broad market risk appetite.
Summary: The Dominant Force Is the Uptrend, the Immediate Question Is Extension
BNB's technical picture on October 28, 2026 presents a coherent but nuanced reading. The dominant force — daily moving average alignment, price above the daily upper Bollinger Band, daily RSI rising from a non-overbought level, daily MACD histogram positive and widening — is bullish. There are no signals on the daily chart that indicate a trend reversal is imminent or even probable.
The tension exists at the execution level. Hourly RSI at 75.8 and 15-minute RSI at 80.8 describe a short-term expression of the daily trend that has become stretched. The 15-minute MACD histogram narrowing while RSI rises introduces a momentum divergence that further weakens the case for immediate continuation without at least a brief consolidation.
The resolution is provided by the pivot-level scenarios: an hourly close above $762.74 (R1) confirms continuation; an hourly close below $758.44 (S1) activates the controlled pullback scenario. The daily technical structure, with EMA20 at $741.79 and the daily upper Bollinger Band at $755.34, provides a deep support zone that preserves the bullish daily case through any near-term pullback that stops short of those levels.
For traders monitoring BNB, the precision-level inputs are the hourly candle closes — not live prices — at the pivot boundaries defined above. The live prices at the time of this analysis ($759.30 on the hourly, $758.87 on the 15-minute) describe the current state but do not constitute confirmed technical signals until their respective candles close.
All price data, indicator readings, and volume figures reflect conditions as of the analysis publication time. Live candle prices are subject to change before their respective candles close. This analysis is for informational purposes only and does not constitute investment advice.
Want to join the discussion? Login and create a profile to comment.