Ethereum Outperformed Bitcoin by 28 Percentage Points in Q3 2026 — October Is Already Stress-Testing That Lead

Ethereum ended Q3 2026 with a 71.0% gain against Bitcoin’s 42.7%, snapping a three-quarter losing streak and drawing $3.1 billion in net inflows into US spot Ethereum ETFs. The rally has since pulled back: ETH was trading near $2,418 on October 19, about 9.9% below its Q3 close, while spot ETH ETF outflows hit $542 million in the week to October 9.
Key Takeaways
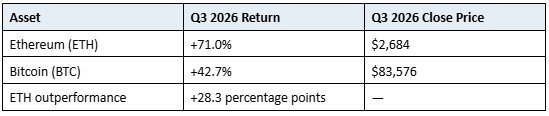
Ethereum gained 71.0% in Q3 2026, closing at $2,684 — its best quarterly return in over a year, ending three consecutive quarters of underperformance against Bitcoin.
Bitcoin rose 42.7% over the same period, closing near $83,576; ETH outperformed by roughly 28 percentage points.
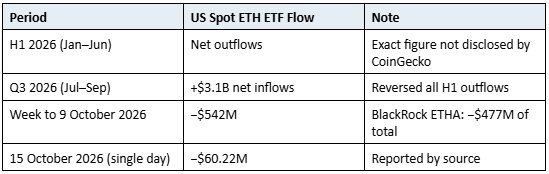
US spot Ethereum ETFs recorded $3.1 billion in net inflows during Q3, reversing all outflows from the first half of 2026.
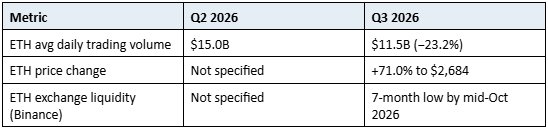
ETH’s average daily trading volume fell 23.2% to $11.5B in Q3, down from $15.0B in Q2, suggesting price rose faster than underlying market participation.
The Glamsterdam upgrade did not ship in Q3; it reached the Sepolia testnet on 6 October 2026.
ETH traded at roughly $2,418 on 19 October, about 9.9% below its Q3 close; Ethereum exchange liquidity hit a 7-month low on Binance by mid-October.
Spot ETH ETFs saw $542M in outflows in the week to 9 October, with BlackRock’s ETHA accounting for $477M of that figure.
Q3 2026 by the Numbers: ETH vs BTC
CoinGecko’s Q3 2026 report provides the baseline. Ethereum opened the year near $2,966 and closed Q3 at $2,684, a 71.0% gain from its Q3 starting point. Bitcoin closed the quarter near $83,576, up 42.7%. The gap between the two assets — roughly 28 percentage points — was the widest it had been in several quarters.
Why the Gap Opened in July
The divergence began early in the quarter. In July, Ethereum gained approximately 22% against roughly 9% for Bitcoin. Fund flows contributed significantly: the arrival of consistent institutional buying through US spot Ethereum ETFs created sustained demand pressure that Bitcoin ETFs were not matching at the same rate.
CoinGecko’s report notes that ETH ended its three-quarter losing streak relative to Bitcoin, which itself had seen Bitcoin ETF inflows collapse 88% in early October compared to Q3 levels. The implication is that institutional allocation shifted toward ETH during the quarter, at least in part at the expense of Bitcoin inflow momentum.
Spot ETH ETF Flows: What $3.1 Billion Actually Means
The US spot Ethereum ETF market had a difficult first half of 2026. Net outflows through June left the products with a negative cumulative flow position. The $3.1 billion that entered during Q3 was not purely additive growth — it first had to absorb the overhang from the prior two quarters before building a net positive position.
The Concentration Problem in ETHA
The October outflow data reveals a structural concern. Of the $542 million that left US spot ETH ETFs in the week to October 9, BlackRock’s ETHA product accounted for $477 million, or roughly 88% of total outflows. When a single product dominates both inflows and outflows at this scale, the flow picture is less a reflection of broad retail or institutional conviction and more a function of one large manager’s allocation decisions.
A further $60.22 million left ETH ETFs on October 15 alone. The pace of outflows in early October is not yet at a level that would erase Q3 gains, but it demonstrates how quickly the inflow thesis can unwind when a dominant product reverses direction.
Volume vs Price: A Divergence Worth Noting
One of the more significant data points in CoinGecko’s Q3 report is the gap between price performance and trading activity. ETH’s average daily trading volume fell 23.2% quarter-on-quarter, dropping from $15.0 billion in Q2 to $11.5 billion in Q3 — even as the price rose 71%.
What Falling Volume During a Rally Signals
A price rally accompanied by declining volume typically indicates that the move is being driven by a reduction in sell-side supply rather than an increase in buy-side demand. In ETH’s case, this interpretation is consistent with the exchange liquidity data: by mid-October, Ethereum exchange liquidity on Binance had reached a 7-month low.
Thin exchange order books can amplify price moves in both directions. If sell pressure returns with any force into a low-liquidity environment, the downside can be sharper than the volume data alone would suggest. CoinGecko’s own framing acknowledges this: prices rebounded faster than participation, which is a cautionary note about the sustainability of the Q3 move rather than a confirmation of it.
The Glamsterdam Upgrade: What It Is and What It Missed
Ethereum’s Glamsterdam upgrade was not delivered during Q3 2026. It reached the Sepolia testnet on 6 October 2026, meaning it is in its pre-mainnet testing phase at the time of writing.
Why It Matters for ETH Price and Layer 2 Safety
Glamsterdam is a scheduled Ethereum hard fork. Its relevance to cryptocurrency investors goes beyond the immediate price effect of the announcement. The source article notes that network questions go beyond price, specifically flagging that Ethereum Layer 2 safety depends on risks that volume and speed metrics cannot capture.
Layer 2 networks — such as Arbitrum, Optimism and Base — rely on Ethereum’s base layer for security guarantees. Protocol upgrades that affect how fraud proofs, state roots or data availability work on mainnet have downstream implications for every application and asset that sits on top of an L2. The delay of Glamsterdam into Q4 means those updates have not yet been validated on mainnet and cannot yet be relied upon by L2 developers or users.
No deployment date for Glamsterdam on Ethereum mainnet has been confirmed in the source material used for this article.
ETH’s October Price Action: Reading the Seven-Day Chart
At approximately 11:10 UTC on 19 October 2026, ETH was trading at $2,418.13. That represents a 5.0% decline over the prior seven days and places the asset roughly 9.9% below its Q3 closing price of $2,684. The BTC/ETH pair stood at 0.02936388, reflecting ETH’s partial reversal of its Q3 relative gains.
Day-by-Day Price Movements (13–19 October)
The seven-day chart opened near $2,540 on 13 October. Price dipped to approximately $2,420 the same day before recovering to $2,530. On 15 October, ETH slid to around $2,340, then bounced to a local peak near $2,475 on 16 October. The subsequent decline brought price to a low near $2,330 on 19 October, with a partial recovery to $2,430 by the time of the data snapshot.
The pattern is a series of lower highs and lower lows across the week, consistent with short-term bearish pressure. This does not invalidate the Q3 narrative, but it does mean that holders who entered near the Q3 close are currently sitting on unrealised losses.
How Durable Is the ETH Outperformance Thesis?
The Q3 data makes a clear case that ETH can outperform Bitcoin when institutional flows are favourable. The October data makes an equally clear case that those flows are not guaranteed to persist. Three factors are worth monitoring in the near term.
1. ETF Flow Direction
The Q3 rally was materially driven by $3.1 billion entering US spot ETH ETFs. The Q4 trajectory will depend on whether institutional buyers continue to allocate to ETH products or rotate back toward Bitcoin ETFs, which historically attract more consistent inflows from pension funds, endowments and wealth management platforms.
2. Exchange Liquidity
Ethereum exchange liquidity hitting a 7-month low on Binance cuts both ways. A low supply of ETH available on exchanges can support price during periods of demand, but it also means that any large sell order hits a thinner book and creates proportionally larger downside moves. Watching exchange reserve data alongside ETF flows gives a clearer combined picture than either metric alone.
3. The Glamsterdam Mainnet Timeline
If Glamsterdam deploys to Ethereum mainnet in Q4, it could act as a near-term catalyst for renewed interest in the ETH price and the broader L2 ecosystem. If it is delayed further, the absence of a protocol upgrade narrative removes one potential source of demand that developers and ecosystem participants tend to front-run.
Frequently Asked Questions
How much did Ethereum outperform Bitcoin in Q3 2026?
Ethereum gained 71.0% in Q3 2026, closing at $2,684. Bitcoin gained 42.7%, closing near $83,576. The outperformance gap was approximately 28 percentage points, according to CoinGecko’s Q3 2026 report.
How much did US spot Ethereum ETFs take in during Q3 2026?
US spot Ethereum ETFs recorded $3.1 billion in net inflows during Q3 2026. That reversed all net outflows from the first half of the year. In the week to 9 October 2026, those same products saw $542 million in outflows, with BlackRock’s ETHA accounting for $477 million.
Why did Ethereum’s trading volume fall while the price rose?
ETH’s average daily trading volume fell 23.2% to $11.5 billion in Q3, down from $15.0 billion in Q2, even as the price rose 71.0%. CoinGecko noted that prices rebounded faster than participation, which suggests the rally was driven more by a reduction in available supply on exchanges than by a broad increase in active buyers.
What is the Glamsterdam upgrade and when does it launch?
Glamsterdam is a scheduled Ethereum hard fork. It did not ship during Q3 2026 and reached the Sepolia testnet on 6 October 2026. No confirmed mainnet launch date has been announced in the source material used for this article.
Where is ETH trading now relative to its Q3 close?
As of approximately 11:10 UTC on 19 October 2026, ETH was trading at $2,418.13, roughly 9.9% below its Q3 closing price of $2,684. The asset had declined about 5.0% over the prior seven days.
Want to join the discussion? Login and create a profile to comment.