Solana ETFs Record Worst Outflow Week in History as SOL Clings to $100 Support With a Head-and-Shoulders Pattern in Play

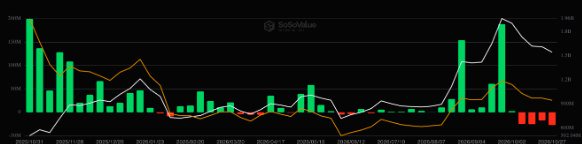
US spot Solana ETFs have suffered their worst outflow week on record. Tuesday's $19.16 million exit — the largest single-day redemption since December 3, 2025 — pushes the weekly total to $27.38 million with trading sessions still remaining, already surpassing every prior weekly outflow in the products' history. October has become by far the worst month for Solana ETF flows, with $99.62 million in net redemptions compared to just $787,000 in the only other month in the red. Meanwhile, SOL is trading at $101.87, less than $2 above the $100 level that technical analysts identify as the neckline of a potential head-and-shoulders pattern — a formation whose confirmation would, by pattern projection, target $80.
Key Facts
Solana ETFs lost $19.16 million on October 27 (Tuesday) — their largest single-day outflow since December 3, 2025's record $32.19 million exit (SoSoValue data)
Combined with Monday's $8.23 million outflow, the week-to-date total of $27.38 million already surpasses the previous worst weekly outflow of $25.52 million (week ending October 16)
Month-to-date October outflows stand at $99.62 million — by far the worst month since launch; June, the only other negative month, lost approximately $787,000
Total net assets in US Solana ETFs fell to $1.54 billion from $1.96 billion on September 25; cumulative net inflows dropped approximately $93 million over that span, meaning price depreciation accounts for most of the AUM decline
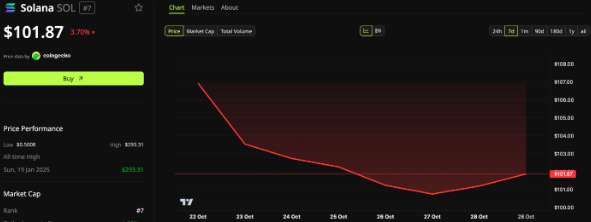
SOL climbed 1.92% to $101.87 on the day (BeInCrypto Markets data), but the price has dropped 13.8% month-to-date and 3.7% over the past week — putting October on track to be the eighth losing month of 2026
A head-and-shoulders technical pattern with a neckline near $100 was flagged on October 21; a daily close below $100 would confirm the pattern and open a measured-move target of $80
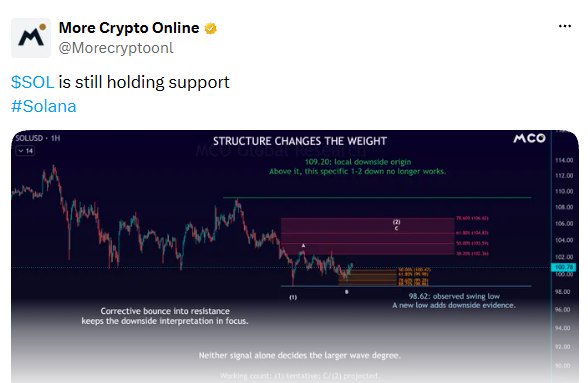
MCO Global Research places hourly support between $98.86 and $100.47, with a swing low at $98.62
CryptoRank data shows November has historically produced a median SOL gain of 15.3% since 2020 — but last November the token fell 28.3% even as the newly launched ETFs drew $419.38 million, their biggest monthly inflow on record
The ETF Flow Data: An Escalating Redemption Story
US spot Solana ETFs are a relatively young product class, having launched to give institutional and retail investors regulated exposure to SOL's price performance without the complexity of direct crypto custody. The SoSoValue data tracking daily flows into and out of these products provides a real-time window into how institutional sentiment toward SOL is shifting.
The picture that October's data paints is unambiguous: this has been a month of consistent and deepening redemptions.
The Weekly Record Falls
October's first significant outflow week ended October 9, with $24.81 million leaving the funds — a week made notable partly because it ended a 14-week consecutive buying streak. Fourteen straight weeks of net positive flows represented sustained institutional accumulation; the reversal signalled a meaningful shift in positioning.
The following week (ending October 16) saw an even larger $25.52 million in outflows — a new record at the time. Both of those previous weekly records have now been surpassed by the current week, which had already accumulated $27.38 million in outflows through just two sessions (Monday and Tuesday). The trend is not improving.
Tuesday's $19.16 million single-day exit is the largest in nearly 11 months, exceeded only by the $32.19 million that left on December 3, 2025. That December event currently stands as the all-time daily record. If redemptions continue at a similar pace for the remainder of the week, the current week's total could rival or exceed the December period's impact.
Source: https://sosovalue.com/assets/etf/Total_Crypto_SOL_ETF_Fund_Flow?page=usSOL
October Dwarfs Every Other Negative Month
The month-to-date outflow of $99.62 million puts October in an entirely separate category from the Solana ETFs' prior negative months. June — the only other month in which the funds saw net redemptions — lost approximately $787,000 total. October's outflows are approximately 127 times larger. This is not a continuation of a recurring pattern; it is an extreme outlier in the funds' short history, occurring in a month characterised by broad crypto market risk-aversion.
The AUM Decomposition: Flows vs. Price
Total net assets in US Solana ETFs declined from $1.96 billion on September 25 to $1.54 billion — a reduction of approximately $420 million. Cumulative net inflows fell by approximately $93 million over the same period. The arithmetic is straightforward: of the $420 million in AUM decline, only $93 million reflects actual money leaving the ETF products through redemptions. The remaining $327 million — the large majority — reflects the decline in the value of SOL held within the funds, caused by the token's 13.8% price fall in October.
Source: https://beincrypto.com/price/solana/
This decomposition matters for interpreting the outflow story accurately. The ETF redemptions are a genuine signal of reduced institutional appetite for Solana exposure, but they are not the primary driver of the AUM decline. SOL's price performance is doing more damage to the funds' total assets than the investors choosing to exit. Both dynamics are negative; they are not equivalent in scale.
SOL at $101.87: How Thin the Margin Is
Despite recording significant ETF outflows on Tuesday, SOL's spot price actually rose 1.92% to $101.87 on the day. This apparent contradiction — institutional redemption pressure and rising price — reflects how ETF flows and spot market price movements are influenced by different but overlapping pools of participants and mechanisms. ETF redemptions reduce institutional exposure through regulated fund products; spot buying and selling on exchanges simultaneously reflects a broader participant base. On this particular day, spot buyers outweighed sellers despite the ETF redemptions.
The price gain is constructive on the surface, but the absolute level is the more important context: $101.87 is less than $2 above the $100 threshold that multiple technical frameworks identify as the critical support zone.
The Head-and-Shoulders Setup: What the Pattern Projects
On October 21, with SOL trading near $106, BeInCrypto's technical analysis team flagged a head-and-shoulders formation developing on SOL's daily chart.
The head-and-shoulders pattern is one of the most widely recognised reversal signals in technical analysis. It consists of three consecutive peaks: a left shoulder (an initial high), a head (a subsequent higher high), and a right shoulder (a third high, lower than the head and approximately equal to the left shoulder). The "neckline" connects the troughs on either side of the head — the points at which the price reversed after each shoulder peak.
The pattern's bearish implication activates when the price breaks below the neckline after forming the right shoulder. The textbook price target for a confirmed head-and-shoulders breakdown is calculated by taking the distance from the head's peak to the neckline and subtracting that measurement from the neckline's level. In SOL's case, with the neckline near $100 as flagged on October 21, a confirmed daily close below that level projects a measured-move target of approximately $80.
What makes $100 the neckline: The $100 level appears to represent where buyers have consistently re-entered after each shoulder peak, providing horizontal support that has defined the pattern's lower boundary. As long as SOL closes above $100 on a daily basis, the head-and-shoulders is unconfirmed and the bullish case for a recovery remains intact.
What happens if $100 breaks: A single intraday touch of $100 does not confirm the pattern — technical analysts specifically require a daily closing price below the neckline. If SOL closes below $100 on any upcoming trading day, it would constitute technical confirmation and introduce $80 as the primary downside target in this pattern framework. The $80 level also represents approximately another 21% decline from current prices.
MCO Global Research's Support Framework
MCO Global Research provides a more granular view of near-term support using hourly chart analysis:
Hourly support zone: $98.86–$100.47 — the range within which the firm's analysis identifies buying activity at shorter timeframes
Swing low: $98.62 — the most recent significant price trough, which if breached would establish a lower low within the downtrend
Upside invalidation: $109.20 — the level above which MCO considers the bearish technical count invalidated
The MCO framework reinforces the $100 level's importance but places the more significant swing low at $98.62 — meaning the buffer between current prices and a structurally bearish signal may be slightly thinner than the round-number analysis suggests. A move below $98.62 would confirm a lower low in the hourly structure and, in MCO's view, would add evidence for further downside rather than being an incidental dip.
The $109.20 upside invalidation level gives bulls a clear target: regaining that level would shift the near-term technical picture from bearish to potentially neutral, removing the immediate downside risk framework. The gap between current prices ($101.87) and the invalidation level ($109.20) represents approximately 7.2% of upside that would need to be captured.
October's Context: Eight Losing Months in 2026
SOL's 13.8% decline in October fits within a broader pattern for 2026. If October closes in the red — as seems likely given the trajectory — it will be the eighth losing month of the year. That is a striking statistic: in a twelve-month year, SOL would have produced negative monthly returns in eight of the first ten months, a very high proportion of losing months even by crypto standards.
The month-to-date decline of 13.8% is meaningful in absolute terms but also in relative terms. Compared to the broader crypto market's difficult October — with Bitcoin also trading near multi-month lows and the memecoin sector losing over $11 billion in market cap from its September high — SOL's performance reflects systemic market weakness rather than Solana-specific deterioration alone. However, the ETF outflow data does suggest that Solana-specific positioning among ETF investors has been particularly active in reducing exposure, potentially reflecting concerns about Solana's technical picture beyond what other assets face.
The November Seasonality Question
One of the more intriguing data points in the analysis is CryptoRank's historical November seasonality figure for SOL: a median gain of 15.3% since 2020. For investors looking for a catalyst to reverse October's damage, the calendar pattern offers a historically grounded basis for optimism.
However, the counterexample is immediately present in the same data: last November (2025), SOL fell 28.3% despite the Solana ETFs attracting $419.38 million in inflows — their best month on record and, at the time, a reflection of strong institutional enthusiasm for the newly launched spot ETF products.
That 2025 precedent carries a specific warning for anyone building a bullish case around November seasonality. It demonstrates that:
Historical medians are not guarantees. A median gain across five to six annual observations includes both the 15.3% central tendency and the outliers — including a year in which the actual outcome was a 28.3% loss.
Strong ETF inflows did not protect the price. In November 2025, $419 million flowed into the ETFs while the price fell by more than a quarter. This means that the institutional demand expressed through the ETF channel was insufficient to overcome the selling pressure in the broader SOL market — which could come from on-chain sellers, derivatives markets, venture capital unlock schedules, or other factors.
The current flow backdrop is already negative. Entering November with $99.62 million in October ETF outflows means the funds are arriving at the seasonally favourable month from a position of institutional distribution rather than accumulation. Whether spot buyers can absorb both the ETF redemptions and any additional selling pressure will likely determine whether SOL's price can hold $100 and subsequently recover.
The $100 Decision Point: What Each Side Needs
The next significant development in SOL's price action will be determined at or near the $100 support zone. The stakes are clear for both bulls and bears:
For bulls to maintain the case: SOL needs to hold above $100 on daily closes consistently over the coming days. A failure to break down despite significant ETF redemption pressure would signal that spot demand is absorbing the selling and that the head-and-shoulders neckline is holding as support. Recovery above MCO's $109.20 invalidation level would shift technical momentum more decisively.
For bears to confirm the pattern: A daily close below $100 — not just an intraday touch — would technically confirm the head-and-shoulders and activate the $80 measured-move projection. Combined with the $98.62 swing low identified by MCO, a sustained close below $100 could quickly become a test of $98.62, and below that, the $80 technical target.
The central variable the article identifies — whether spot buyers absorb ETF redemptions — is precisely the right question. ETF redemptions require the fund manager to sell the underlying SOL to return cash to the redeeming investor. If spot market buyers absorb that sold SOL at or above $100, the price holds. If spot buyers are absent or insufficient, the selling pushes prices below the support level.
Summary
US spot Solana ETFs are having their worst week and worst month in their history. The $27.38 million week-to-date outflow through Tuesday already surpasses every prior week's redemptions, and October's $99.62 million in cumulative outflows represents approximately 127 times the losses of June — the only other negative month since launch. Total net assets have fallen from $1.96 billion to $1.54 billion since September 25, driven primarily by SOL's 13.8% October price decline rather than by outflows alone. SOL holds $101.87, less than $2 above the $100 neckline of a head-and-shoulders pattern: a daily close below $100 would confirm the pattern and project a $80 target, while recovery above $109.20 would invalidate the bearish count. November's historically positive seasonality (median +15.3% since 2020) offers a potential calendar catalyst, but last November's 28.3% decline — occurring alongside a record $419 million month of ETF inflows — is a live reminder that historical patterns and fund flows together cannot guarantee price direction. Whether spot buyers absorb the ongoing ETF redemption pressure at $100 is the most important variable determining SOL's immediate trajectory.
Want to join the discussion? Login and create a profile to comment.