Tron’s 30-Day Chain Revenue Topped Ethereum and Solana Combined — Here Is What the Figures Actually Show

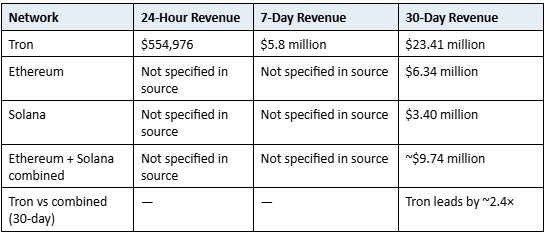
Tron recorded $23.41 million in chain revenue over the past 30 days according to DefiLlama, exceeding Ethereum’s $6.34 million and Solana’s $3.40 million combined. The gap is real, but the revenue figure reflects transaction fees collected by the network during the period — not profit, not growth, and not the full economic picture. This article unpacks what the number means and what it leaves out.
Key Takeaways
Tron’s 30-day chain revenue of $23.41 million exceeded Ethereum’s $6.34 million and Solana’s $3.40 million combined (~$9.74 million), meaning Tron generated roughly 2.4 times as much in fees as both networks together.
Tron’s lead holds across shorter timeframes: $5.8 million over seven days and $554,976 over 24 hours, both ahead of Ethereum and Solana individually for the same periods.
The revenue figures represent transaction fees paid by users, not a measure of network profitability, token price performance or year-on-year growth.
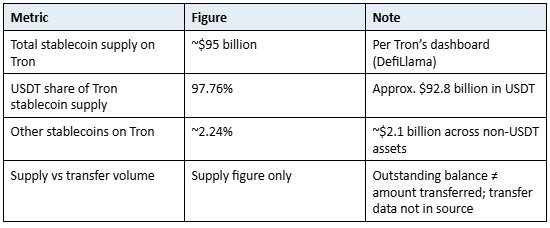
Tron’s stablecoin supply stood at approximately $95 billion, with USDT accounting for 97.76% of that total — making Tron the dominant blockchain for USDT settlement by outstanding balance.
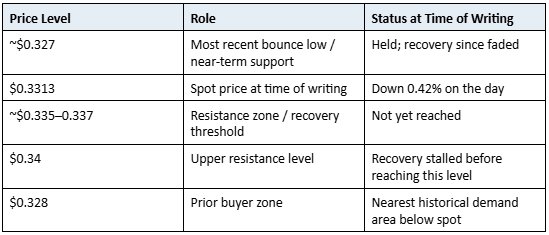
TRX was trading near $0.3313 at the time of writing, down 0.42%, after a rebound from around $0.327 stalled before reaching the $0.335–0.337 resistance zone.
The outstanding stablecoin supply figure does not reveal how much was actually transferred, nor how revenue splits across payment, trading or other use cases.
What Chain Revenue Means — and What It Does Not
Chain revenue, as measured by DefiLlama, represents the transaction fees paid by users of a network during a given period. It is a supply-side income metric: when a Tron user sends USDT or interacts with a smart contract, they pay a fee denominated in TRX. Those fees, aggregated across all on-chain activity, make up the revenue figure.
This is distinct from several things that the number is sometimes confused with. It is not the same as validator or miner profit (some fees are burned, depending on the protocol). It is not a measure of network growth, since it shows only the total collected during the measurement window, not whether that total is higher or lower than the prior period. And it is not a direct measure of user activity volume, since fee income depends on both the number of transactions and the fee rate per transaction.
Why the Comparison Has Limits
Comparing Tron’s revenue to Ethereum’s and Solana’s in isolation does not account for the fact that the three networks charge very different fee rates by design. Ethereum’s base fee mechanism, introduced with EIP-1559, adjusts fees according to block demand and can produce high per-transaction costs during congested periods. Solana’s fee model is designed for near-zero costs to encourage high throughput. Tron’s fee structure occupies a middle position, with fees low enough to make USDT transfers economical but meaningful enough to generate aggregate revenue at scale.
A network that charges higher fees per transaction will show higher revenue per unit of activity. A network that processes more transactions at lower fees may show lower revenue despite more underlying usage. The ranking among Tron, Ethereum and Solana reflects their respective fee models as much as it reflects the level of economic activity on each chain.
The Revenue Breakdown: 30-Day, 7-Day and 24-Hour
DefiLlama’s data provided revenue readings across three timeframes. Tron led across all three at the time the data was captured.
What the Multi-Period View Adds
The consistency of Tron’s lead across 24-hour, 7-day and 30-day windows suggests the fee advantage is structural rather than the result of a single spike event. A network that briefly surged in fee revenue due to a specific high-demand episode (such as an NFT mint or a token launch) would be expected to show a narrower gap in the 30-day figure than in shorter windows. The data here shows the opposite: the lead is proportionally similar across all three periods.
That said, the source data does not include the prior 30-day period for any of the three networks, so it is not possible to confirm from these figures alone whether Tron’s fee revenue has increased, decreased or stayed flat. The ranking shows current output, not trajectory.
USDT’s Dominance of Tron’s Stablecoin Supply
Tron’s on-chain dashboard showed approximately $95 billion in total stablecoin supply at the time of writing. Of that, USDT accounted for 97.76%, equivalent to roughly $92.8 billion. The remaining $2.1 billion or so is spread across other stablecoin assets on the network.
Why Tron Became USDT’s Primary Settlement Layer
Tether issues USDT across multiple blockchains, including Ethereum, Tron, Solana and others. Tron’s USDT supply has consistently ranked among the largest of those chains because of its combination of low transaction costs and fast confirmation times. A transfer of USDT on Tron typically costs a fraction of what the same transfer would cost on Ethereum’s mainnet, making Tron the preferred rail for high-frequency, cost-sensitive USDT movement — particularly in remittance corridors and peer-to-peer transfers in markets where dollar access is valued.
The $95 billion figure is an outstanding balance, not a throughput number. It measures how much USDT currently sits in wallets on the Tron network, not how much has moved through it. High outstanding balances mean Tron is a preferred storage layer for USDT; high transfer volumes would additionally confirm it is a preferred settlement layer. The source data does not provide transfer volume for comparison.
Revenue Attribution: What the Fees Do Not Tell Us
The $23.41 million in 30-day chain revenue covers all fee-generating activity on Tron. It does not break down what share of that came from USDT transfers, DeFi interactions, smart contract deployments or other on-chain actions. Given that USDT makes up 97.76% of Tron’s stablecoin supply, it is reasonable to infer that stablecoin transfers contribute a substantial share of fee revenue — but the exact split is not disclosed in the source data.
TRX Price: The Rebound That Ran Out of Steam
TRX, Tron’s native token, was trading near $0.3313 at the time of writing, down 0.42% on the day. The price had recently bounced from a low around $0.327, but that recovery had not extended to the $0.334–0.337 resistance zone that would signal a more sustained move.
What the Price Structure Shows
The pattern described — a bounce from $0.327 that fades before reaching $0.337 — is consistent with a market where buyers are present at lower prices but not strong enough to maintain upward momentum. The $0.328 area is identified as the nearest historical level where buyers had previously stepped in, making it the first meaningful reference point if price pulls back from its current level.
A sustained move above $0.337 would suggest that buying interest is broadening rather than concentrated at the lower support zone. Until that happens, the price structure is one of contained recovery rather than trend reversal. The source does not provide broader context on TRX’s medium-term performance or any correlation with Tron’s revenue data.
Revenue vs Price: Two Separate Signals
It is worth noting that Tron’s strong fee revenue does not automatically translate into TRX price appreciation. Fee revenue accrues to the network as a whole; how much of it flows to TRX holders depends on Tron’s specific tokenomics, including what portion of fees is burned versus distributed and at what rate. The source describes TRX’s recent trading as dull relative to the network’s revenue performance, which suggests the market has not priced the fee data into the token yet — or does not consider it a primary TRX valuation driver.
How Tron’s Revenue Position Fits the Broader Blockchain Landscape
The three networks in this comparison occupy distinct positions in the blockchain ecosystem. Ethereum is the largest smart contract platform by total value locked and developer activity, and its revenue reflects high per-transaction costs on a network with substantial DeFi, NFT and tokenisation use. Solana is optimised for throughput and low fees, with its revenue base spread across a high volume of lower-cost transactions. Tron sits in a different niche: its revenue is heavily concentrated in stablecoin settlement, with USDT transfers as its primary use case.
A revenue comparison across all three is meaningful as a snapshot of fee income but does not resolve questions about which network is growing fastest, which has the most developer activity, or which is best positioned for the next cycle of blockchain adoption. Each metric captures a different dimension of network health.
Frequently Asked Questions
What does chain revenue mean in this context?
Chain revenue, as reported by DefiLlama, is the total transaction fees paid by users of a blockchain during a specified period. It is not profit, not a measure of growth, and not the same as token price performance. It measures how much users collectively paid to use the network.
How did Tron’s revenue compare to Ethereum and Solana?
Over the most recent 30-day period in the source data, Tron generated $23.41 million in chain revenue. Ethereum generated $6.34 million and Solana $3.40 million, for a combined total of approximately $9.74 million. Tron’s figure was roughly 2.4 times the Ethereum and Solana combined total.
Why does Tron have so much USDT?
Tron’s combination of low transaction fees and fast confirmation times has made it a preferred blockchain for USDT transfers, particularly for cost-sensitive use cases such as remittances and peer-to-peer dollar transfers. Tether issues USDT on multiple chains, and Tron’s outstanding USDT balance of approximately $92.8 billion (97.76% of its total stablecoin supply) reflects its position as the primary settlement layer for USDT by outstanding balance.
What are the key TRX price levels to watch?
At the time of writing, TRX was near $0.3313 after bouncing from around $0.327. The $0.328 area is the nearest prior demand zone. A recovery above $0.337 would suggest the rebound is gaining traction; $0.34 is the next meaningful resistance above that.
Does Tron’s high revenue mean TRX should be worth more?
Not directly. Fee revenue accrues to the network; its impact on TRX depends on Tron’s tokenomics, including what share of fees is burned or distributed to holders. The source notes that TRX’s recent price performance has been subdued relative to the network’s revenue figures, suggesting the market has not treated fee income as an immediate TRX price catalyst.
Disclaimer: This article is for informational purposes only and does not constitute financial or investment advice. Price figures and on-chain data are sourced from DefiLlama and reflect conditions at the time of the original data capture. Markets change rapidly; verify current figures before making any decision.
Want to join the discussion? Login and create a profile to comment.