XRP Price Analysis: Whale Exodus and Bearish Technicals Raise Prospect of Drop Below $1

Crypto analyst Ali Martinez has issued a cautionary note for XRP holders, warning that a combination of declining whale wallet counts, rising exchange supply, and multiple bearish technical indicators could put the $1.00 psychological level under pressure if XRP loses the key support at $1.26. The warning arrives against a paradoxical backdrop: institutional inflows into XRP-related products remain robust and demand for Ripple's RLUSD stablecoin continues to expand — yet the price has struggled to hold its gains. Meanwhile, derivatives traders are positioned heavily on the long side, creating a crowded trade that could amplify any downside move if the support breaks.
Key Takeaways
Analyst Ali Martinez warned on X that wallets holding 10–100 million XRP declined from 351 to 339 over the past several weeks, suggesting some large holders are reducing exposure
Exchange-held XRP rose from 11.003 billion to approximately 11.05 billion — roughly 50 million additional tokens moved to trading platforms where they can more easily be sold
Martinez has identified $1.26 as the critical support level: the lower boundary of a price channel XRP has formed since August
A confirmed break below $1.26 would first target $1.11, with the channel pattern projecting a move to $0.98 — approximately 22% below the key support
The MACD indicator is flashing a "Sell" signal for XRP on TradingView; the Awesome Oscillator has also turned bearish
The RSI remains in neutral territory, suggesting XRP is neither technically oversold nor overbought at current prices
Despite the bearish technicals, approximately 78% of top trader accounts on Binance with open XRP positions are positioned long, according to Coinglass data
Whale Activity: The On-Chain Warning Sign
One of the most closely watched signals in cryptocurrency markets is the behaviour of large wallets — commonly referred to as "whales." These are addresses holding substantial token quantities whose buying and selling decisions can materially influence price, particularly for assets like XRP where individual wallet sizes can represent significant percentages of daily trading volume.
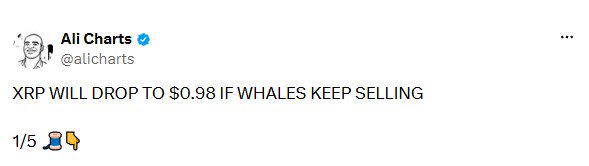
Ali Martinez, a prominent cryptocurrency analyst with a large following on X, flagged a notable shift in XRP's large-wallet distribution in a Sunday post. According to his analysis, the number of wallets holding between 10 million and 100 million XRP declined from 351 to 339 over the past several weeks. While a reduction of 12 wallets may appear modest in absolute terms, the position sizes involved mean the aggregate token movement is anything but trivial — each wallet in this bracket holds between $12.6 million and $126 million in XRP at the $1.26 support level, implying the reduction represents a meaningful reallocation of capital out of long-term XRP positions.
The direction of those tokens adds further weight to the concern. A wallet reducing its XRP holding does not automatically represent a bearish signal — tokens could move to a different wallet for custody, staking, or operational reasons. But the concurrent rise in exchange-held supply tells a more specific story.
Exchange Inflows: Supply Pressure Building on Trading Platforms
Martinez highlighted that the amount of XRP held on cryptocurrency exchanges — the pools of supply directly available for spot market trading — increased from 11.003 billion to approximately 11.05 billion over the same period. That increase of roughly 50 million XRP represents tokens that have migrated from private custody to exchange wallets, placing them one step closer to the order books.
Source: https://x.com/alicharts/status/2114304587280896055
In on-chain analysis, exchange inflows are a widely used metric for assessing near-term sell pressure. The logic is straightforward: tokens held in self-custody are not immediately available to sell; tokens deposited to exchanges are. An increase in exchange-held supply does not guarantee imminent selling, but it expands the available float and suggests that at least some holders are positioning to sell rather than to accumulate.
Martinez framed it plainly in his X post: "That's roughly 50 million more XRP on trading platforms. If large holders continue moving tokens to exchanges, more supply could become available to sell."
The pattern of declining large-wallet counts combined with rising exchange supply is a confluence that technical and on-chain analysts typically treat as a bearish signal — not because any individual data point is definitive, but because the two metrics together suggest that holders with the most influence over price are moving toward the exit rather than adding to positions.
The Key Support Level: Why $1.26 Matters
Martinez's technical analysis centres on a price channel that XRP has been trading within since August. Channel patterns are a foundational tool in technical analysis: they identify a range of prices bounded by an upper line of resistance (where selling tends to emerge) and a lower line of support (where buying has historically materialised), with the price oscillating between the two over time.
The lower boundary of this channel — which Martinez identifies as sitting at approximately $1.26 — has served as a structural floor for XRP's price action during the period since August. Each time XRP has approached this level, buying interest has emerged sufficient to halt the decline and push the price back toward the upper portion of the range.
The analytical significance of $1.26 is therefore not arbitrary — it represents a level where demonstrated buying support has previously prevented further downside. But that also means it is the level whose loss would send the clearest technical signal to market participants that the structure has changed.
What Happens If $1.26 Breaks?
Martinez's projection for a break below $1.26 involves two sequential downside targets:
First target: $1.11. This level likely corresponds to the next identifiable support zone below the channel floor — a price where previous buying interest or technical structure would be expected to slow any decline.
Second target: $0.98. This is the channel pattern's ultimate projection if the breakdown is sustained — a level approximately 22% below the current channel support at $1.26. The $0.98 level carries additional psychological significance as it sits below $1.00, a round number that has historically acted as a threshold with outsized market sentiment implications.
A move below $1.00 for XRP would likely generate significant media attention and could trigger reactive selling from holders who use the round number as a mental stop-loss or risk management threshold, potentially amplifying the move beyond what pure technical analysis would predict.
Technical Indicators: Multiple Signals Pointing Bearish
Martinez's on-chain and structural analysis is reinforced by multiple standard technical indicators, each of which is currently providing bearish or neutral readings for XRP according to TradingView data.
MACD: Active Sell Signal
The Moving Average Convergence Divergence (MACD) indicator is one of the most widely used tools in technical analysis for identifying changes in trend momentum. It works by comparing two exponential moving averages of price — typically a 12-period and a 26-period EMA — and plotting the difference between them as the "MACD line." A signal line (typically a 9-period EMA of the MACD line itself) is overlaid, and buy or sell signals are generated when the two cross.
When the MACD line crosses below the signal line, it is interpreted as a bearish signal — momentum is shifting to the downside. According to TradingView's analysis at the time of writing, the MACD is currently generating a "Sell" signal for XRP, indicating that short-term momentum has turned negative relative to the medium-term trend.
Awesome Oscillator: Turned Bearish
The Awesome Oscillator (AO) is a momentum indicator developed by trader Bill Williams that measures the difference between a 5-period simple moving average and a 34-period simple moving average of the bar's midpoints. It compares recent price momentum to the broader historical context, providing a reading of whether buying or selling pressure is dominant relative to the norm.
The Awesome Oscillator for XRP has "flipped bearish" according to the article — meaning momentum has shifted from positive (recent price action stronger than the longer-term average) to negative (recent price action weaker). Like the MACD, this indicator is confirming a shift in the near-term momentum environment rather than providing a price target, but the direction of the signal is consistent with the broader cautionary picture Martinez is painting.
RSI: Neutral — Neither Oversold Nor Overbought
The Relative Strength Index (RSI) is an oscillator that moves between 0 and 100, measuring the speed and magnitude of recent price changes to identify potentially overbought conditions (typically above 70) or oversold conditions (typically below 30). At the time of writing, XRP's RSI was reading in the "Neutral" zone — suggesting the asset is neither stretched to the upside nor cheap enough on momentum grounds to attract contrarian buying.
A neutral RSI reading is notable in the context of the other bearish signals. It indicates that XRP has not yet experienced the kind of sharp, accelerated sell-off that drives RSI into oversold territory and typically attracts bargain hunters. If XRP were to break below $1.26 with the RSI in neutral territory, the sell-off would have room to extend further before RSI signals a technically oversold condition — meaning the downside targets Martinez identifies at $1.11 and $0.98 would have less technical friction to work through than they would if RSI were already at oversold levels.
The Long Position Paradox: Crowded Bulls and Contrarian Risk
Against this backdrop of bearish on-chain data and negative technical momentum, one data point stands in striking contrast: approximately 78% of top trader accounts on Binance with open XRP positions are currently positioned long, according to Coinglass derivatives data.
This extremely lopsided long positioning creates a paradox that experienced traders are familiar with: when a trade becomes sufficiently crowded, it can amplify downside moves rather than support prices.
When the overwhelming majority of leveraged participants are positioned long, the market faces a specific vulnerability known as a "long squeeze" or "cascade liquidation." If the price moves against the dominant position — in this case, falling below key support levels — traders holding leveraged long positions begin receiving margin calls or hitting stop-loss levels. Their forced selling pushes the price down further, triggering more liquidations, which drives the price down further still in a self-reinforcing cycle.
The 78% long ratio on Binance from Coinglass is therefore a double-edged data point. On one hand, it reflects genuine bullish conviction among sophisticated derivatives traders who are presumably conducting their own analysis and concluding XRP will move higher. On the other hand, if the $1.26 support level breaks, that crowded long positioning could transform from a bullish signal into an accelerant for the very decline Martinez is warning about.
The Fundamental Backdrop: Why the Bearish Case Is Complicated
What makes this technical picture particularly interesting is that it sits against a fundamental backdrop that remains arguably constructive for XRP as an asset.
Institutional Inflows Remain Robust
Despite the price weakness and the technical sell signals, institutional inflows into XRP-related investment products have continued at a healthy pace. This suggests that institutional capital — typically characterised by longer time horizons and more fundamental-driven analysis than retail or derivatives traders — has not yet capitulated from its XRP positions. Persistent institutional demand is one of the factors that could provide buying support at key levels and potentially limit the depth of any downside move.
RLUSD Demand Continues to Grow
Ripple's USD-denominated stablecoin, RLUSD, has seen growing demand since its launch. RLUSD is built on the XRP Ledger (XRPL) and Ethereum, and its adoption creates a direct utility connection between stablecoin usage and the XRP ecosystem — both through the transaction fees paid in XRP on the XRPL and through the broader liquidity and visibility that stablecoin activity brings to the network.
A growing RLUSD ecosystem does not directly support XRP's spot price in the short term, but it represents an expanding real-world use case for the XRP Ledger that may become more price-relevant as adoption scales.
The Contradiction: Strong Fundamentals, Weak Technicals
The combination of robust institutional inflows and growing stablecoin demand on one side, and bearish technical indicators with whale selling pressure on the other, presents a classic tension between fundamental and technical analysis. Different market participants will weight these inputs differently.
Short-term traders and momentum-focused participants will likely focus on the technical picture — the MACD sell signal, the bearish Awesome Oscillator, and the exchange inflow data — and position defensively. Longer-term holders and fundamental investors may view any pullback to $1.11 or $0.98 as a potential accumulation opportunity given the underlying ecosystem growth.
Neither interpretation is necessarily wrong. They reflect different time horizons and different risk tolerances.
Scenarios to Watch
Based on Martinez's analysis and the available technical data, there are two principal scenarios that XRP market participants should monitor:
Bearish scenario — $1.26 breaks: If XRP fails to hold the August channel's lower boundary at $1.26, Martinez's analysis suggests an initial move toward $1.11 becomes the base case. Should that level also fail to provide meaningful support, the channel pattern's full projection targets $0.98 — a sub-$1.00 level that would likely draw significant negative sentiment and potentially accelerate selling through a combination of stop-loss triggers and retail panic. In this scenario, the 78% long positioning on Binance becomes a risk multiplier rather than a support factor, as cascading long liquidations could push price well through technical targets before stabilising.
Bullish scenario — $1.26 holds: If XRP successfully defends the $1.26 level on any test — particularly if that defence comes on meaningful volume — it would validate the channel structure and could set up a move back toward the channel's upper resistance. In this scenario, the high long positioning among derivatives traders would be vindicated, and the exchange inflow data may prove to have represented temporary repositioning rather than sustained distribution. The neutral RSI reading provides support for this interpretation: an asset that has not yet reached oversold levels can and does reverse without hitting those extremes.
What to Watch in the Coming Days
Several specific data points are worth tracking for investors and traders following XRP's near-term trajectory:
Exchange inflow trends: If the 50 million XRP added to exchange wallets is followed by further inflows in the coming days, the distribution narrative gains credibility. Conversely, if on-chain data shows those tokens being withdrawn back to private wallets, it would suggest repositioning rather than selling intent
Whale wallet count: A continued decline in 10–100 million XRP wallets deepens the bearish on-chain case; stabilisation or recovery would reduce concern
MACD signal evolution: Watch for whether the MACD sell signal strengthens (histogram expanding negative) or begins to narrow, which would precede any bullish crossover
RSI trajectory: If XRP's price declines further, tracking when RSI reaches oversold territory (below 30) identifies the zone where technical buying typically emerges
Derivatives open interest and funding rate: A spike in negative funding rates for XRP perpetual futures (meaning short sellers are paying longs) would signal that market sentiment has flipped sufficiently bearish to set up a potential short squeeze — the mirror image of the long squeeze risk currently present
Summary
Ali Martinez's Sunday analysis presents a coherent bearish case for XRP in the near term, supported by three converging signals: declining whale wallet counts (351 to 339 in the 10–100 million XRP bracket), rising exchange supply (+50 million XRP on trading platforms), and multiple bearish technical indicator readings including an active MACD sell signal and a bearish Awesome Oscillator flip. The $1.26 level — the lower boundary of XRP's August price channel — is the crucial line in the sand: below it, Martinez projects moves to $1.11 and ultimately $0.98, a 22% decline from current support. The fact that approximately 78% of top Binance traders are positioned long adds a potential liquidation amplifier to any downside break. Against this stands a fundamental picture that remains constructive, with institutional inflows continuing and RLUSD stablecoin demand growing — suggesting that if a technical breakdown does occur, it may create an entry opportunity for longer-term participants rather than representing a fundamental deterioration in XRP's ecosystem.
Want to join the discussion? Login and create a profile to comment.