XRP Price Rebounds From $1.25 Support: The First Bullish Signal Since the September Sell-Off

After weeks of persistent selling pressure, XRP has finally printed a green daily candle. The move is modest, but it is the first real sign of buyer strength the XRP market has shown since the September plunge, and it puts a key support zone and a few clear resistance levels in focus.
Key Takeaways
XRP is trading near $1.31 after a daily gain, its first bullish daily close in weeks.
The token slid through most of October, falling from roughly $1.55 to a low near $1.25.
The $1.25–$1.30 zone is acting as support, confirmed by a long lower wick on the daily candle.
Immediate resistance sits near $1.33, with a heavier moving-average cluster at $1.37–$1.38.
RSI is near 40 and trading volume remains low, so the broader trend is still bearish until proven otherwise.
XRP Breaks a Weeks-Long Streak of Red Candles
XRP is changing hands close to $1.31 following a daily gain, marking the first time since September that buyers have managed to take control of a full trading session. For most of October the token was in a clear downtrend, sliding from the $1.55 region to a local low near $1.25 before finally showing signs of life.
That decline was orderly and one-sided. Red candles dominated the daily chart, and every attempt at a relief rally was sold almost immediately. The result was a textbook pattern of lower highs, the classic signature of a market where sellers are in charge and rallies are treated as exit opportunities rather than entry points.
Why a Small Bounce Still Matters
On its own, a single green candle does not change the trend. However, context is important. A green daily close that arrives directly after a sharp, extended drop suggests that selling momentum is starting to fade at this price level. In other words, the sellers who drove XRP lower throughout October appear to be running out of steam, at least for now.
For traders and investors watching the XRP/USD chart, this is the first piece of evidence in weeks that demand is returning. It is not a confirmation of a trend reversal, but it is the kind of early signal that often precedes one, provided that follow-through buying appears in the sessions that follow.
$1.25–$1.30: The Support Zone Bulls Need to Defend
The most important technical feature of this bounce is where it happened. The $1.25 to $1.30 range is currently acting as a support zone for XRP. Price dipped into this area and quickly moved away from it, leaving a long lower wick on the daily candle.
In candlestick analysis, a long lower wick shows that sellers pushed the price down during the session, but buyers stepped in, absorbed that selling and drove the price back up before the close. It is a visual record of demand overpowering supply at a specific level.
This zone also has history. Earlier in September, the same area held the price and served as the launch pad for a strong rally to $1.65. When a support level holds more than once, it tends to gain significance among market participants, which makes the current reaction more meaningful than a random bounce in the middle of a range.
Resistance Ahead: Where the XRP Recovery Will Be Tested
First Hurdle: The Moving Average Near $1.33
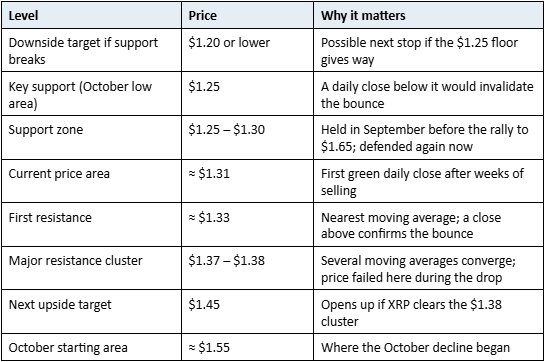
The first real test for the recovery sits just above the current price. The nearest moving average on the daily chart is positioned around $1.33. For the bounce to show genuine strength, XRP needs to secure a daily close above this level. Failing to do so would suggest that the move is simply a pause within the ongoing downtrend.
Heavy Resistance: The $1.37–$1.38 Moving Average Cluster
Above $1.33, the picture gets more challenging. Several longer moving averages converge in the $1.37 to $1.38 area, creating a dense resistance cluster. Zones where multiple moving averages meet often act as strong barriers, because traders who follow different timeframes are watching the same price region. Notably, XRP was unable to hold above this area during its most recent decline, which means sellers have already defended it once.
Momentum Check: RSI and Trading Volume
RSI Near 40: Weak, but Not Oversold
The Relative Strength Index (RSI), a momentum oscillator that moves between 0 and 100, is currently reading close to 40. Readings below 30 are typically considered oversold and readings above 70 overbought, so a value of 40 sits in weak but neutral territory.
This has two implications. First, the bounce is not coming from an extreme oversold low, so it cannot be explained purely as a technical snap-back. Second, the indicator has plenty of room to climb before reaching overbought conditions, which leaves space for further upside if buyers maintain control.
Volume Remains the Missing Piece
The weak spot in the bullish case is trading volume, which remains low. Sustainable recoveries are usually accompanied by rising volume on green days, as it shows that fresh capital is entering the market rather than short sellers simply taking profit. Until volume picks up on up-moves, any rally should be treated with caution.
XRP Price Outlook: Bullish and Bearish Scenarios
Bullish Scenario
For the bulls, the primary objective is a daily close above $1.33. If that happens, the path opens toward the $1.38 resistance cluster. A decisive break above $1.38 would then bring the next upside target of $1.45 into play and would mark a meaningful shift in the short-term market structure.
Bearish Scenario
The bearish trigger is equally clear. If XRP loses the $1.25 level, the bounce would be invalidated and the support zone would effectively fail. In that case, the price could slide toward $1.20 or lower, extending the downtrend that has defined the past several weeks.
Key XRP Price Levels at a Glance
Bottom Line: Trend Reversal or Brief Pause?
For now, the dominant trend in XRP remains bearish. Lower highs, low volume and a stack of moving averages overhead all argue for caution. Even so, the first bullish signal in weeks has appeared, and it has done so at a support zone with a proven track record.
The next few daily candles will be decisive. A close above $1.33 backed by rising volume would strengthen the case for a genuine reversal, while a drop back below $1.25 would suggest this was merely a short-lived relief bounce before another leg down.
Frequently Asked Questions
Why is XRP bouncing now?
XRP reached the $1.25–$1.30 support zone, an area that also held in September. Buyers stepped in there, leaving a long lower wick and producing the first green daily close after weeks of selling.
What is the key support level for XRP?
The critical level is $1.25. As long as XRP stays above it, the bounce remains valid. A break below could send the price toward $1.20 or lower.
What resistance levels should XRP traders watch?
The first resistance is near $1.33, followed by a stronger cluster of moving averages at $1.37–$1.38. Clearing both would open the way toward $1.45.
Is the XRP downtrend over?
Not yet. The broader trend is still down, RSI is weak and volume is low. A confirmed daily close above $1.33 with stronger volume would be the first step toward a trend change.
Want to join the discussion? Login and create a profile to comment.