XRP Slips to $1.29 as Fed's Hawkish Hold and Bearish Derivatives Positioning Cap Recovery — $1.333–$1.372 EMA Cluster Is the Line in the Sand
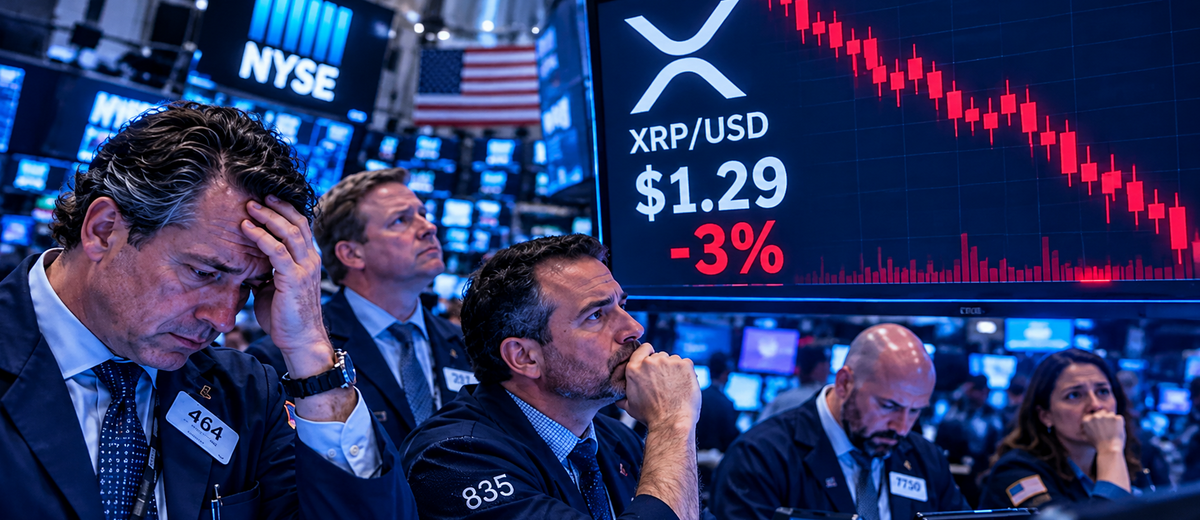
XRP has broken below the $1.300 support level on Thursday, trading around $1.29 as the Federal Reserve's decision to hold interest rates at 3.75%–4.00% — with a hawkish undertone on inflation — reinforced the risk-off environment that has kept buying pressure limited throughout October. CoinGlass data shows the long-to-short ratio at 0.82, approaching its lowest reading in more than a month and confirming that derivatives positioning remains net short. The technical picture offers a single constructive signal — the MACD has ticked into mildly positive territory — but the RSI at 40 and price below all three major exponential moving averages leave the burden of proof squarely on the bulls. Reclaiming the $1.333–$1.372 EMA cluster would shift the picture; losing $1.300 on a daily close would confirm a deterioration.
Key Takeaways
XRP is trading around $1.29, below the $1.300 support level that has served as a horizontal floor in recent weeks
The Federal Reserve held rates unchanged at 3.75%–4.00%, but hawkish language on inflation weighed on risk appetite for assets including XRP
CoinGlass data: long-to-short ratio at 0.82, approaching its lowest reading in over a month — shorts outweigh longs in tracked derivatives accounts
XRP funding rate: 0.0036%, positive since turning higher on October 16 — longs are paying shorts, indicating leveraged bullish demand persists alongside the bearish positioning
The divergence between a bearish long-to-short ratio and a positive funding rate leaves XRP's derivatives signals mixed but with bears in firm control on the spot price
CryptoQuant indicators show sell-side dominance in both spot and futures; large whale orders are flagged but their direction (buying or selling) cannot be established from the size data alone
Daily RSI: 40 — below the 50 neutral line, indicating limited buying momentum
MACD: slightly positive — an early sign of easing bearish momentum, though insufficient to change the trend
Resistance cluster: 100-day EMA at $1.333, 50-day EMA at $1.357, 200-day EMA at $1.372 — three layers of overhead that must be cleared for a durable recovery
Further upside levels once the cluster is cleared: $1.540 and $1.900
The Macro Trigger: The Fed's Hold and Its Hawkish Framing
Thursday's XRP weakness does not exist in isolation — it reflects a broader risk-asset dynamic set in motion by the Federal Reserve's interest rate decision and, more importantly, the language that accompanied it.
The FOMC held rates at 3.75%–4.00% — a decision that was in line with market expectations. For a rate hold to be interpreted as neutral or bullish for risk assets, it typically needs to come with language that signals the tightening cycle is definitively over or that cuts are coming. This week's meeting provided neither. The Fed's statement and Chair commentary instead reflected continued concern about inflation, signalling that the committee is not yet satisfied that price pressures are sufficiently contained to begin easing.
This "hawkish hold" is arguably the most challenging monetary policy framing for risk assets. A cut would be clearly stimulative; a hike would be clearly tightening; a hold with dovish language would signal the end of tightening. A hold with hawkish language means the terminal rate is maintained at restrictive levels for longer — sustained pressure on risk asset valuations without the catalyst of a shift in direction.
For XRP specifically, the macro transmission runs through two channels. First, elevated rates increase the opportunity cost of holding volatile, non-yielding digital assets relative to safe investments like Treasury bills or money market funds. Second, the hawkish language reinforces a risk-off positioning bias among institutional participants who have been systematically reducing exposure to higher-risk assets throughout October — consistent with the $99.62 million in Solana ETF outflows and broader crypto market pressure documented elsewhere this week.
Derivatives Positioning: The Mixed Signal and What It Actually Means
The most analytically interesting element of XRP's current setup is the contradiction between two derivatives metrics that are typically read in the same direction.
Long-to-Short Ratio at 0.82: More Shorts Than Longs
CoinGlass tracks the proportion of accounts holding long versus short positions across major derivatives exchanges. XRP's long-to-short ratio at 0.82 means that for every account holding a long position, approximately 1.22 accounts hold short positions. As a ratio below 1, it confirms that short sellers outnumber long holders in the tracked dataset — a bearish positioning signal that has been approaching its most extreme reading in over a month.
When the long-to-short ratio is this low, it reflects one of two situations: either bearish conviction is genuinely high (participants are actively betting on further XRP declines), or speculators are hedging long spot positions with futures shorts (reducing net exposure without fully exiting). Either interpretation is consistent with cautious or bearish sentiment toward XRP at current prices.
Funding Rate at +0.0036%: Longs Still Paying
The XRP funding rate tells a seemingly different story. In perpetual futures markets, the funding rate is the periodic payment exchanged between long and short position holders to keep the futures price anchored to the spot price. When the funding rate is positive, longs pay shorts — signalling that the futures price is trading at a premium to spot, which reflects a marginal bullish bias in leveraged derivatives demand.
XRP's funding rate of 0.0036% is positive and has remained so since turning higher on October 16. This means that even with more short positions than long positions by account count, the participants holding long futures positions are still willing to pay a premium to maintain that leveraged bullish exposure.
Understanding the Divergence
How can there be more shorts than longs by account while longs are paying a premium? The resolution lies in position size rather than account count. The long-to-short ratio measures accounts, not notional value. If the relatively smaller number of long accounts hold significantly larger aggregate positions than the larger number of short accounts, the notional balance can still tilt in favour of longs — producing a positive funding rate despite a sub-1 long-to-short ratio.
This kind of divergence is a mixed signal for short-term price direction. It suggests that large-sized bullish positions are competing against a greater number of smaller bearish positions — a configuration that can produce either a short squeeze (if the underlying demand pushes price higher, forcing smaller short accounts to cover) or continued price weakness (if the bearish account count reflects broad-based negativity that the fewer, larger longs cannot overcome at the current macro backdrop).
For now, the spot price's break below $1.300 gives the edge to the bearish reading.
CryptoQuant's Read: Sell-Side Dominance With Whale Activity
CryptoQuant, the on-chain and market flow analytics platform, provides a separate dimension of the positioning picture through its market summary indicators.
For XRP, CryptoQuant is reporting sell-side dominance across both spot markets (where actual XRP is bought and sold for immediate delivery) and futures markets (where leveraged derivative exposure is traded). Sell-side dominance in both venues simultaneously means that selling pressure is not confined to one market segment — it is a broad-based characteristic of the current market microstructure.
CryptoQuant also flags two additional data points for XRP: large whale orders and heating market conditions. The whale order flag indicates that unusually large individual orders are present in XRP markets — suggesting that significant capital is actively engaged. The "heating market conditions" signal reflects elevated activity levels relative to recent norms.
Importantly, the presence of large orders establishes that significant capital is moving but does not establish whether that capital is net buying or selling. A large order could represent a major holder accumulating at $1.29 support or a major holder distributing into any available buying. Given that CryptoQuant simultaneously shows sell-side dominance and whale-sized order presence, the most consistent interpretation is that the large orders include selling — large positions being disposed of into a market that cannot absorb them without price impact, driving the sell-side imbalance the other indicators reflect.
XLM Context: Similar Pressure, Similar Conclusion
Stellar Lumens (XLM), a blockchain-based payments token with a use case closely related to XRP's in cross-border settlement and financial inclusion, faces comparable market conditions. CryptoQuant's indicators for XLM also show sell-side advantage in both spot and futures markets, suggesting that XLM's recent rebound — in contrast to XRP's continued decline — has not yet attracted sufficient sustained buying demand to hold higher levels. The mention of XLM here provides context that the current pressure on XRP reflects conditions that are not unique to the XRP-specific narrative but also affect closely related assets in the same payment-blockchain category.
Technical Analysis: How the Chart Describes the Current Risk
The $1.300 Break: What It Means
The $1.300 level has served as a horizontal support zone — a price at which buyers have repeatedly materialised to arrest declines. A break below it is significant not because of any mystical property of the round number but because of what it reveals about the current balance of supply and demand: the buyers who previously showed up at $1.300 were insufficient to absorb the selling pressure on Thursday.
The article distinguishes between the live price (currently around $1.29) and a confirmed daily close below $1.300. A daily candle close below $1.300 would be more technically significant than an intraday dip, because it would represent the market's collective verdict for the full trading day. If XRP recovers to close above $1.300 at the daily candle close, the intraday breach would be treated as a test of support that held. If it closes below, the support level would be considered broken on a daily basis — weakening the recent trading range and increasing the probability of a deeper correction.
Daily RSI at 40: Below Neutral But Not Oversold
The Relative Strength Index on the daily chart standing at 40 describes a market in which selling momentum has been dominant but has not reached the oversold extreme (below 30) that typically attracts contrarian buyers. At 40, the RSI is in what many technical analysts call "bearish territory" — it has lost the 50 level that separates bullish and bearish momentum regimes, but it has not fallen far enough to signal exhaustion.
The practical implication for traders is that there is no strong contrarian buying signal from the RSI at current levels. A drop toward 30 would begin to attract attention as a potentially oversold condition; at 40, the momentum picture simply confirms that bears have had the better of the recent price action without providing a reversal signal.
MACD: The One Constructive Signal
The MACD (Moving Average Convergence Divergence) provides the single constructive technical note in an otherwise bearish picture. The indicator has moved slightly into positive territory, meaning the short-term moving average (typically 12-day) has crossed above the longer-term moving average (typically 26-day) by a small margin. The article correctly characterises this as "an early sign of easing bearish momentum" — the improvement suggests the rate of price decline may be slowing.
However, the MACD being barely positive while XRP trades below its 100-day, 50-day, and 200-day EMAs creates an important contextual limitation. A slightly positive MACD is consistent with a short-term momentum bounce within an overall bearish trend — what technicians call a "dead cat bounce" setup. It is not, by itself, evidence of a trend reversal. For the MACD's constructive reading to become meaningful, the price needs to follow through by reclaiming the nearby EMA levels.
The EMA Resistance Cluster: $1.333–$1.372
Three exponential moving averages form overlapping resistance layers in a tight band above the current price:
100-day EMA at $1.333 — the first and nearest obstacle for any recovery attempt. Breaking above it would be a modest but necessary step toward improved technical momentum.
50-day EMA at $1.357 — the medium-term trend average. Price below this level confirms that the trend as measured over the past two months is bearish.
200-day EMA at $1.372 — the long-term trend average. Price below the 200-day EMA is the clearest signal that the broader trend framework is negative.
The compactness of the cluster — spanning only $0.039 from the 100-day to the 200-day — creates a concentrated zone of overhead resistance. If XRP can break through the 100-day EMA with conviction, the 50-day and 200-day follow relatively quickly because of their proximity. But that same proximity means that attempting to break the cluster requires sustained buying pressure against three layers of resistance almost simultaneously. There is no gentle or gradual path through this zone.
Reclaiming the full cluster ($1.333 to $1.372) would provide meaningful evidence that the medium and longer-term trend has shifted back to buyers' favour. It would also likely require and reflect a change in the macro environment — either a Fed pivot signal, reduced geopolitical risk, or XRP-specific positive development.
Targets If Recovery Materialises
The article identifies two levels beyond the EMA cluster that would become relevant in a bullish continuation:
$1.540 — the first significant resistance beyond the EMA zone, representing approximately 19% above the current price
$1.900 — a more distant target, approximately 47% above current levels
Both are characterised as distant from current levels, which is accurate — at $1.29, reaching $1.540 requires a 19.4% rally and reaching $1.900 requires a 47.3% rally. These are not near-term targets; they represent the levels that become relevant only if the EMA cluster is clearly reclaimed and a genuine trend reversal is underway.
The Near-Term Decision: Support or Breakdown
XRP's position around $1.29 — barely below the $1.300 level — creates a binary short-term dynamic. The proximity to support means the situation remains fluid in both directions, but with diminishing buffer.
If $1.300 is reclaimed and holds as support: The intraday breakdown would be seen as a test that was absorbed, and attention would shift back to the $1.333 EMA as the next level to watch. A recovery back above $1.300 with subsequent stabilisation would be a constructive outcome that reduces the near-term breakdown risk.
If the daily close is below $1.300: The technical picture deteriorates meaningfully. There is no immediately obvious technical support level between $1.29 and the next lower reference points, as the article notes that the floor at $1.300 has been the key structure. A breakdown below daily $1.300 would likely see increased selling pressure as stop-loss orders below the level activate and short sellers add to positions on the confirmed break.
The MACD's slight positivity provides a narrow basis for cautious near-term optimism, but it is insufficient to override the bearish weight of the broader technical picture without confirmation from price action itself. For XRP, that confirmation means a daily close back above $1.300 as an immediate test, and sustained progress toward the EMA cluster as the medium-term evidence the bulls need to present.
Summary
XRP has breached the $1.300 support level on Thursday, trading around $1.29 in a session shaped by the Federal Reserve's hawkish hold at 3.75%–4.00%. Derivatives positioning is net short (long-to-short ratio 0.82) but not uniformly bearish — the positive funding rate of 0.0036% signals that leveraged long demand persists, creating a mixed signal that leaves the market directionality unclear at the derivatives level while spot prices trend lower. CryptoQuant's sell-side dominance readings across both spot and futures, combined with flagged whale activity, reinforce a cautious near-term outlook. The daily RSI at 40 confirms limited buying momentum without providing an oversold reversal signal, and while the MACD has edged into positive territory as an early easing of bearish momentum, XRP remains below its 100-day ($1.333), 50-day ($1.357), and 200-day ($1.372) EMAs. Clearing that entire cluster is the technical test that would establish the bulls have genuinely regained control; a daily close below $1.300 is the signal that the short-term support structure has broken. XRP's next few daily candles will likely determine which of these scenarios is playing out.
Want to join the discussion? Login and create a profile to comment.