Zcash Rebounds More Than 6% After Buyers Hold the 0.382 Fibonacci Level — Two Resistance Hurdles Now Stand Between ZEC and a Confirmed Recovery

Zcash (ZEC) gained more than 6% on Tuesday, trading near $1,224 after buyers stepped in at the 0.382 Fibonacci retracement of the June–September rally near $1,140. Price broke above the October falling channel during the session. Two overhead levels — the 50-day SMA near $1,270 and the 0.236 Fibonacci level near $1,350 — will determine whether Tuesday’s move marks the start of a recovery or another bounce within the broader correction.
Key Takeaways
ZEC gained more than 6% on Tuesday, trading near $1,224 after a session range of approximately $1,118 to $1,232 against a $1,151 open.
Buyers defended the 0.382 Fibonacci retracement near $1,140 after the price spent roughly a week consolidating at that level, with wicks dipping toward $1,050 without triggering a deeper breakdown.
Tuesday’s rally broke above the October falling channel’s upper boundary, but the daily candle had not yet closed at the time of writing — the breakout is not confirmed until it does.
The first confirmation level is the 50-day SMA near $1,270, currently about 4% above spot. ZEC slipped below this average in mid-October; reclaiming it would mark the end of the short-term downtrend.
The second hurdle is the 0.236 Fibonacci level near $1,350, about 10% above spot. This level capped the last mid-October bounce, when a wick reached approximately $1,345 before sellers took control.
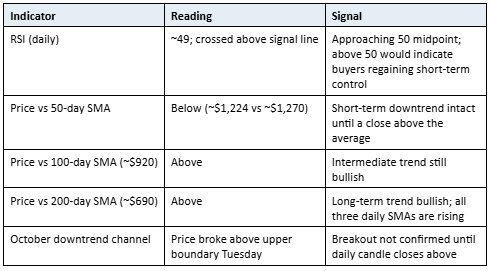
RSI has turned up to approximately 49, crossing above its signal line and approaching the 50 midpoint. A push above 50 would indicate buyers are regaining short-term control.
ZEC remains about 28% below its September peak near $1,690, but still trades more than 380% above its June 2026 low of approximately $254. All three daily SMAs are rising.
The Rally That Built the Current Setup: June to September 2026
Understanding Tuesday’s session requires the context of the move that preceded it. ZEC ran more than sixfold between early June and late September 2026, climbing from approximately $254 to its cycle high near $1,690. That rally — roughly 565% top to bottom — was the starting point for the Fibonacci retracement levels now acting as the key reference prices.
A rally of that magnitude will typically see a portion of those gains given back during a consolidation or correction phase. The question for technical traders is how deep that correction goes and where buyers reassert themselves. The Fibonacci retracement framework maps the most commonly watched levels: the 0.236, 0.382, 0.5 and 0.618 retracements of the original move.
Why $1,140 Was the Line Buyers Defended
The 0.382 Fibonacci retracement of the June–September rally falls near $1,140. This is the shallowest retracement level commonly treated as a meaningful correction within an ongoing uptrend. Buyers stepping in here is consistent with the interpretation that the rally remains intact and the correction is a normal pullback rather than a trend reversal.
The price spent approximately a week consolidating around $1,140, with wicks dipping toward $1,050 on multiple sessions. The wicks indicate that sellers tested levels below $1,140 but were unable to close the daily candle there — a sign that buyers were absorbing the selling pressure rather than retreating from it. Tuesday’s 6% move higher is the first session that clearly shifted that balance.
The October Falling Channel: What Breaking It Means
After the September peak near $1,690, ZEC entered a short falling channel characterised by lower highs and lower lows bounded by two downward-sloping trendlines. The channel’s upper boundary acts as resistance; each time price approached it from below in October, sellers pushed it back.
Tuesday’s session broke above that upper boundary during intraday trading. A channel breakout of this kind is one of the more commonly referenced technical signals for a potential trend change at the short-term timeframe. However, intraday breaks are less reliable than confirmed daily closes above the boundary, because price can return inside the channel before the session ends. At the time of writing, the daily candle had not yet closed.
The Importance of the Daily Close
The source article explicitly flags that “the daily candle has yet to close” as a reason for caution. This is technically correct and important: a daily close above the channel boundary would add confirmation weight to the breakout, while a close back inside the channel would effectively negate it. Traders watching for a confirmed channel breakout will be looking at Tuesday’s closing price, not the intraday high.
Two Overhead Hurdles: The 50-Day SMA and the 0.236 Fibonacci Level
Even if Tuesday’s session closes above the channel boundary, two levels of overhead resistance stand between ZEC’s current price and a full recovery to the September highs.
First Hurdle: 50-Day SMA Near $1,270
The 50-day simple moving average sits near $1,270, approximately 4% above Tuesday’s trading price of $1,224. ZEC slipped below this average in mid-October, and it has since acted as overhead resistance. Reclaiming the 50-day SMA would be a technically meaningful event: it would place price back above a commonly watched medium-term trend indicator and could mark the end of the short-term downtrend rather than simply another bounce within it.
The 50-day SMA is not a static level — it moves daily as new price data replaces older data. If ZEC consolidates at current levels for several sessions, the SMA will drift toward spot rather than spot drifting toward the SMA. Either path produces the same technical outcome if price can close above the average.
Second Hurdle: 0.236 Fibonacci Level Near $1,350
The 0.236 Fibonacci retracement of the June–September rally falls near $1,350, approximately 10% above Tuesday’s price. This level carries particular significance because it was where the most recent mid-October bounce failed: a wick reached approximately $1,345 before sellers took control and drove price back below $1,140 over subsequent sessions.
A resistance level that has already rejected a bounce attempt is considered a stronger level than one that has not yet been tested, because it represents a price where sellers demonstrated willingness to sell in quantity. For ZEC to confirm that the September correction is over rather than merely paused, it would need to close decisively above $1,350, not simply touch it.
Momentum Indicators: RSI Approaching the Midpoint
What RSI at 49 Signals — and What It Does Not
RSI (Relative Strength Index) measures the pace and magnitude of recent price changes on a scale of 0 to 100. Readings below 30 are conventionally associated with oversold conditions; above 70 with overbought. The 50 level is the midpoint, and crossing above it from below is commonly interpreted as a shift from bearish to neutral-to-bullish momentum.
ZEC’s RSI at approximately 49, crossing above its signal line, is a modest positive signal: momentum is improving from recent lows and approaching the neutral midpoint. It is not a strong bullish signal. An RSI that moves from 49 to 52 carries less weight than one that has broken above 60 from a sustained period below 50. The current reading suggests the selling pressure of the past three weeks is easing, not that strong buying pressure has arrived.
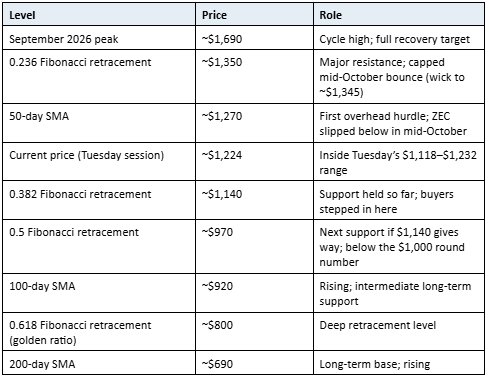
The Full Price Ladder: Support and Resistance Reference Map
The following table maps all key levels from the September peak to the long-term moving average base.
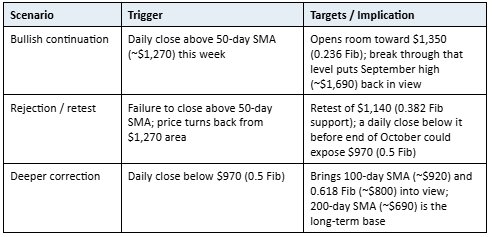
Potential Scenarios from Here
The Bigger Picture: 380% Above the June Low
ZEC still trades more than 380% above its June 2026 low of approximately $254, and all three daily simple moving averages — 50-day, 100-day, and 200-day — are rising. In a rising-SMA environment, corrections tend to find buyers before the deeper retracement levels are reached. The fact that $1,140 (the 0.382 level) held after testing wicks toward $1,050 is consistent with that pattern.
The bear case for a breakdown below $970 would require sustained selling pressure that has not yet been demonstrated during this correction. The 100-day SMA near $920 and the 0.618 Fibonacci level near $800 would be the targets in that scenario. The 200-day SMA near $690 is the long-term base: a close below it would represent an entirely different market structure from the one ZEC has been operating in since June.
Frequently Asked Questions
Why did Zcash (ZEC) rise more than 6% on Tuesday?
Buyers stepped in at the 0.382 Fibonacci retracement level near $1,140, which had held as support for roughly a week after ZEC corrected from its September peak near $1,690. Tuesday’s session saw price break above the October falling channel’s upper boundary, triggering a more than 6% intraday gain to near $1,224.
What is the first resistance level ZEC needs to clear for a confirmed recovery?
The 50-day simple moving average near $1,270 is the first key level. ZEC slipped below this average in mid-October. Reclaiming it with a daily close above would mark the end of the short-term downtrend. The second and stronger resistance is the 0.236 Fibonacci level near $1,350, which capped the last mid-October bounce.
What happens if ZEC fails to hold above $1,140?
A daily close below the 0.382 Fibonacci support near $1,140 before the end of October would expose the 0.5 Fibonacci retracement near $970, which sits below the psychologically significant $1,000 level. Below that, the 100-day SMA near $920 and the 0.618 Fibonacci level near $800 would be the next reference points.
What does the RSI reading indicate for ZEC right now?
ZEC’s daily RSI is near 49, crossing above its signal line and approaching the 50 midpoint. A move above 50 would indicate that buyers are regaining short-term control after three weeks of declining momentum readings. The current reading is modestly positive but not yet a strong bullish signal.
Is ZEC still in a long-term uptrend despite the October correction?
Yes, based on the indicators in the source data. ZEC remains more than 380% above its June 2026 low of approximately $254, and all three daily SMAs (50-day, 100-day and 200-day) are rising. The October pullback corrected to the 0.382 Fibonacci level of the June–September rally, which is a shallow retracement within a larger uptrend.
Want to join the discussion? Login and create a profile to comment.